## Line Chart: Question vs. Thinking Importance Scores
### Overview
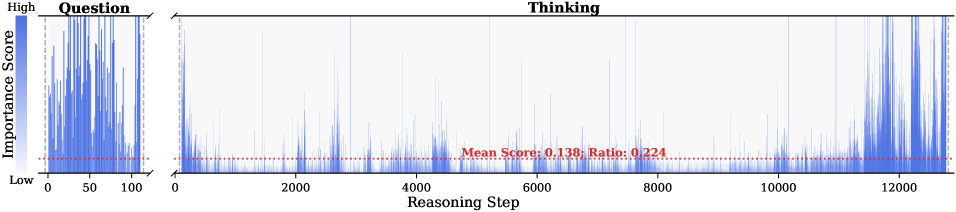
The image presents a line chart comparing the "Importance Score" during a "Question" phase and a "Thinking" phase, plotted against "Reasoning Step". The "Question" phase is represented as a dense cluster of data points on the left, while the "Thinking" phase spans a larger range of reasoning steps. A horizontal dotted line indicates the mean score and ratio for the "Thinking" phase.
### Components/Axes
* **Title:** Thinking
* **Y-axis Label:** Importance Score
* Scale: "High" at the top, transitioning to "Low" at the bottom. The color gradient goes from dark blue to light blue.
* **X-axis Label:** Reasoning Step
* Scale: Ranges from 0 to approximately 12000 in increments of 2000.
* **Left-side Plot:** Question
* X-axis: 0 to 100
* **Horizontal Line (Thinking Phase):** Red dotted line indicating "Mean Score: 0.138; Ratio: 0.224"
### Detailed Analysis
**1. Question Phase (Left Side):**
* The data points are clustered between Reasoning Steps 0 and 100.
* The Importance Score fluctuates rapidly, reaching high values frequently.
* The overall trend is a high variance in importance scores within a small range of reasoning steps.
**2. Thinking Phase (Right Side):**
* The data spans Reasoning Steps from approximately 0 to 12000.
* The Importance Score generally remains low, with occasional spikes.
* The red dotted line represents the mean score of 0.138 and a ratio of 0.224.
* There appear to be clusters of higher importance scores near the end of the "Thinking" phase (around Reasoning Step 12000).
### Key Observations
* The "Question" phase exhibits significantly higher and more frequent peaks in Importance Score compared to the "Thinking" phase.
* The "Thinking" phase is characterized by a relatively low Importance Score, with occasional spikes indicating moments of higher importance.
* The mean score and ratio provide a quantitative measure of the average importance during the "Thinking" phase.
### Interpretation
The chart suggests that the "Question" phase involves a more intense and variable assessment of importance compared to the "Thinking" phase. The "Thinking" phase, while spanning a larger range of reasoning steps, generally maintains a lower level of importance, with occasional bursts of higher importance. The mean score and ratio provide a baseline for understanding the average importance during the "Thinking" phase. The clusters of higher importance scores near the end of the "Thinking" phase could indicate a final evaluation or decision-making process.