## Chart: Importance Score Across Reasoning Steps
### Overview
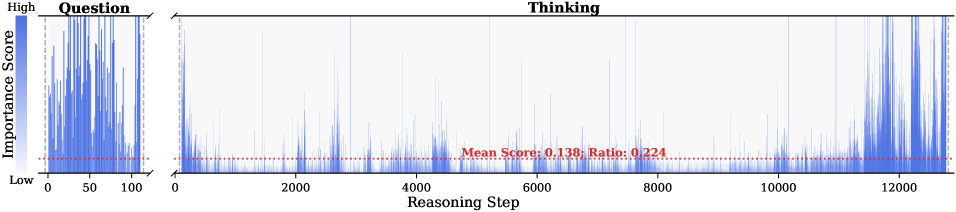
The image displays a two-panel chart visualizing the "Importance Score" of different steps in a reasoning process. The chart is divided into a narrow left panel labeled "Question" and a wide right panel labeled "Thinking," both sharing a common y-axis. The data is represented as a series of vertical blue bars (a bar chart or high-density line plot), where the height of each bar corresponds to an importance score. A horizontal red dashed line in the "Thinking" panel indicates a mean value.
### Components/Axes
* **Y-Axis (Vertical):**
* **Label:** "Importance Score"
* **Scale:** Qualitative, marked with "High" at the top and "Low" at the bottom. No numerical tick marks are provided.
* **X-Axis (Horizontal):**
* **Label:** "Reasoning Step"
* **Scale:** Numerical, linear.
* **Tick Marks (Left Panel - "Question"):** 0, 50, 100.
* **Tick Marks (Right Panel - "Thinking"):** 0, 2000, 4000, 6000, 8000, 10000, 12000.
* **Panel Titles:**
* **Left Panel:** "Question" (positioned top-center of its panel).
* **Right Panel:** "Thinking" (positioned top-center of its panel).
* **Data Series:**
* Represented by blue vertical bars. The color is consistent across both panels.
* **Annotation (in "Thinking" panel):**
* A red dashed horizontal line runs across the panel.
* **Text on Line:** "Mean Score: 0.138; Ratio: 0.224" (positioned near the center, slightly below the line).
### Detailed Analysis
1. **"Question" Panel (Steps 0-100):**
* This panel shows a very high density of blue bars.
* **Trend:** The bars are consistently tall, indicating that importance scores are predominantly "High" throughout the initial 100 reasoning steps. There is significant variability, with many bars reaching near the top of the axis, but no clear upward or downward trend is discernible due to the density.
2. **"Thinking" Panel (Steps 0-12000+):**
* This panel shows a much sparser distribution of blue bars compared to the "Question" panel.
* **Trend:** The vast majority of bars are very short, clustering near the "Low" end of the importance scale. However, there are sporadic, isolated spikes where bars reach medium to high importance.
* **Notable Spike Locations:** Visually prominent spikes occur near steps ~2000, ~4000, ~6000, ~8000, ~10000, and a cluster of high spikes near step 12000.
* **Red Dashed Line:** This line represents a constant value across the "Thinking" steps. Its associated text provides two key metrics:
* **Mean Score: 0.138** - This is the average importance score across all steps in the "Thinking" panel. Given the qualitative y-axis, this numerical value suggests a scoring system where 0 is "Low" and 1 is "High," placing the average firmly in the lower range.
* **Ratio: 0.224** - This likely represents the proportion (22.4%) of reasoning steps in the "Thinking" phase that are considered "important" (e.g., above a certain threshold).
### Key Observations
* **Bimodal Distribution of Importance:** There is a stark contrast between the "Question" phase (consistently high importance) and the "Thinking" phase (predominantly low importance with intermittent spikes).
* **Concentration of Critical Information:** The initial "Question" phase appears to contain the most densely packed important information.
* **Sparse High-Importance Events in Thinking:** The "Thinking" process is characterized by long sequences of low-importance steps punctuated by brief, critical reasoning moments (the spikes).
* **Quantitative Metrics:** The provided mean (0.138) and ratio (0.224) offer a quantitative summary of the "Thinking" phase's importance profile, confirming the visual impression of low average importance with a subset of significant steps.
### Interpretation
This chart likely visualizes the output of an interpretability tool for an AI model or a cognitive process model. It suggests a fundamental difference in the information density between formulating a question and executing a reasoning chain.
* **The "Question" Phase** is information-rich and critical, as every step appears highly important for defining the problem space.
* **The "Thinking" Phase** resembles a search or deliberation process. The model spends most of its steps on low-importance computations (e.g., exploring dead ends, performing routine calculations), with occasional breakthroughs or key deductions (the high-importance spikes). The final cluster of high spikes near step 12000 may indicate the convergence on a solution or the synthesis of the final answer.
* The **Mean Score and Ratio** are crucial for evaluation. A low mean score (0.138) is not necessarily negative; it may simply reflect the nature of exhaustive search. The ratio (0.224) is more telling, indicating that about one-fifth of the thinking steps contribute significantly to the outcome. This metric could be used to compare the efficiency of different reasoning strategies or models.
**In essence, the chart argues that the value in a reasoning process is not evenly distributed. It is heavily front-loaded in the question formulation and occurs in rare, critical bursts during the extended thinking phase.**