## Line Chart: Accuracy vs. Sample Size
### Overview
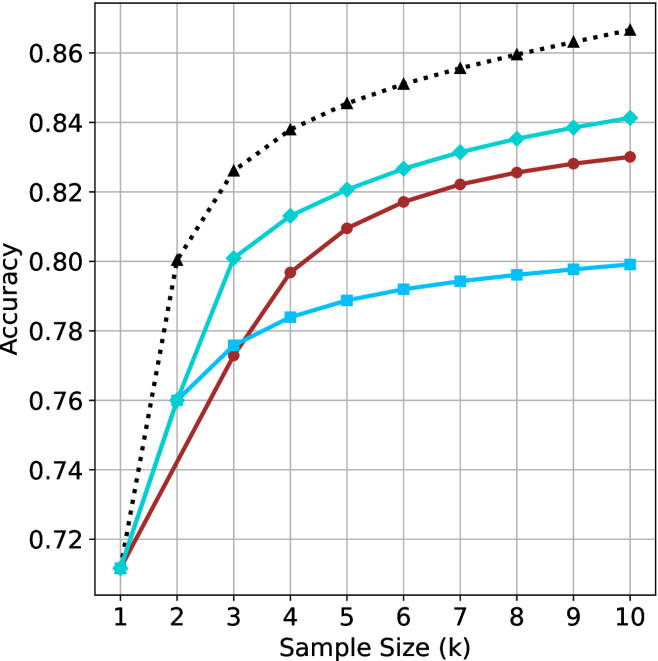
The image is a line chart showing the relationship between "Accuracy" and "Sample Size (k)" for four different data series. The x-axis represents the sample size, ranging from 1 to 10. The y-axis represents accuracy, ranging from 0.72 to 0.86. Four lines with different markers and colors represent different data series.
### Components/Axes
* **X-axis:** Sample Size (k), with values ranging from 1 to 10 in increments of 1.
* **Y-axis:** Accuracy, with values ranging from 0.72 to 0.86 in increments of 0.02.
* **Data Series:** Four data series are represented by lines with different colors and markers:
* Black dotted line with triangle markers.
* Teal line with diamond markers.
* Brown line with circle markers.
* Light blue line with square markers.
### Detailed Analysis
**1. Black Dotted Line with Triangle Markers:**
* Trend: The line slopes sharply upward from sample size 1 to 2, then continues to increase at a decreasing rate, approaching a plateau.
* Data Points:
* Sample Size 1: Accuracy ~0.71
* Sample Size 2: Accuracy ~0.80
* Sample Size 3: Accuracy ~0.83
* Sample Size 4: Accuracy ~0.84
* Sample Size 5: Accuracy ~0.85
* Sample Size 6: Accuracy ~0.855
* Sample Size 7: Accuracy ~0.858
* Sample Size 8: Accuracy ~0.86
* Sample Size 9: Accuracy ~0.862
* Sample Size 10: Accuracy ~0.865
**2. Teal Line with Diamond Markers:**
* Trend: The line slopes upward from sample size 1 to 10, with the rate of increase decreasing as the sample size increases.
* Data Points:
* Sample Size 1: Accuracy ~0.71
* Sample Size 2: Accuracy ~0.76
* Sample Size 3: Accuracy ~0.80
* Sample Size 4: Accuracy ~0.81
* Sample Size 5: Accuracy ~0.82
* Sample Size 6: Accuracy ~0.825
* Sample Size 7: Accuracy ~0.83
* Sample Size 8: Accuracy ~0.835
* Sample Size 9: Accuracy ~0.838
* Sample Size 10: Accuracy ~0.84
**3. Brown Line with Circle Markers:**
* Trend: The line slopes upward from sample size 1 to 10, with the rate of increase decreasing as the sample size increases.
* Data Points:
* Sample Size 1: Accuracy ~0.71
* Sample Size 2: Accuracy ~0.74
* Sample Size 3: Accuracy ~0.77
* Sample Size 4: Accuracy ~0.80
* Sample Size 5: Accuracy ~0.81
* Sample Size 6: Accuracy ~0.82
* Sample Size 7: Accuracy ~0.823
* Sample Size 8: Accuracy ~0.826
* Sample Size 9: Accuracy ~0.828
* Sample Size 10: Accuracy ~0.83
**4. Light Blue Line with Square Markers:**
* Trend: The line slopes upward from sample size 1 to 10, with the rate of increase decreasing as the sample size increases.
* Data Points:
* Sample Size 1: Accuracy ~0.71
* Sample Size 2: Accuracy ~0.76
* Sample Size 3: Accuracy ~0.78
* Sample Size 4: Accuracy ~0.785
* Sample Size 5: Accuracy ~0.79
* Sample Size 6: Accuracy ~0.792
* Sample Size 7: Accuracy ~0.794
* Sample Size 8: Accuracy ~0.796
* Sample Size 9: Accuracy ~0.798
* Sample Size 10: Accuracy ~0.80
### Key Observations
* All four data series show an increase in accuracy as the sample size increases.
* The black dotted line (triangle markers) achieves the highest accuracy across all sample sizes, and its accuracy increases rapidly at smaller sample sizes.
* The light blue line (square markers) has the lowest accuracy compared to the other three lines.
* The rate of increase in accuracy decreases as the sample size increases for all four data series, suggesting diminishing returns with larger sample sizes.
### Interpretation
The chart demonstrates the relationship between sample size and accuracy for four different methods or models. The black dotted line (triangle markers) represents the most effective method, as it consistently achieves the highest accuracy with increasing sample size. The other three methods (teal, brown, and light blue lines) also show improved accuracy with larger sample sizes, but their performance is lower than the black dotted line. The diminishing returns observed for all methods suggest that there is a point beyond which increasing the sample size provides only marginal improvements in accuracy. This information can be used to optimize the sample size for each method, balancing the cost of data collection with the desired level of accuracy.