\n
## Violin Plot: Elementary Math Accuracy
### Overview
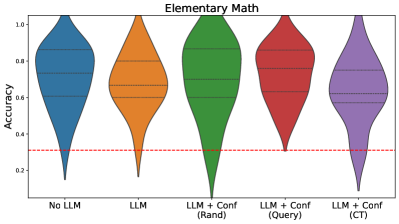
The image presents a violin plot comparing the accuracy of different approaches to solving elementary math problems. Five different methods are compared, ranging from "No LLM" to "LLM + Conf (CT)". The y-axis represents accuracy, and the x-axis represents the different methods. A horizontal dashed line is present at approximately 0.5 accuracy.
### Components/Axes
* **Title:** "Elementary Math" positioned at the top-center of the chart.
* **Y-axis Label:** "Accuracy" positioned on the left side of the chart. The scale ranges from approximately 0.2 to 1.0, with markings at 0.2, 0.4, 0.6, 0.8, and 1.0.
* **X-axis Labels:** The following methods are displayed along the x-axis, from left to right:
* "No LLM"
* "LLM"
* "LLM + Conf (Rand)"
* "LLM + Conf (Query)"
* "LLM + Conf (CT)"
* **Horizontal Line:** A dashed horizontal line is present at approximately y = 0.5.
### Detailed Analysis
The chart uses violin plots to represent the distribution of accuracy scores for each method.
* **No LLM (Blue):** The violin plot is widest at the top, indicating a concentration of accuracy scores near 1.0. The plot tapers down to a point at approximately 0.2. The median accuracy appears to be around 0.8.
* **LLM (Orange):** This violin plot is wider than the "No LLM" plot, but still peaks around 0.8. The distribution is more spread out, with a longer tail extending down to approximately 0.2. The median accuracy appears to be around 0.6.
* **LLM + Conf (Rand) (Green):** This plot is similar in shape to the "LLM" plot, with a peak around 0.9 and a tail extending down to approximately 0.2. The median accuracy appears to be around 0.8.
* **LLM + Conf (Query) (Red):** This plot is wider than the "LLM" plot, with a peak around 0.7. The distribution is more spread out, with a longer tail extending down to approximately 0.2. The median accuracy appears to be around 0.6.
* **LLM + Conf (CT) (Purple):** This violin plot is similar to the "No LLM" plot, with a concentration of accuracy scores near 1.0. The plot tapers down to a point at approximately 0.2. The median accuracy appears to be around 0.8.
### Key Observations
* The "No LLM" and "LLM + Conf (CT)" methods exhibit the highest accuracy, with distributions concentrated near 1.0.
* The "LLM" and "LLM + Conf (Query)" methods have lower accuracy, with more spread in their distributions.
* The "LLM + Conf (Rand)" method shows accuracy similar to the "LLM" method.
* All methods have a tail extending down to approximately 0.2, indicating that some instances resulted in very low accuracy.
* The dashed line at 0.5 serves as a baseline for comparison. All methods generally perform above this baseline.
### Interpretation
The data suggests that using a Large Language Model (LLM) alone does not necessarily improve accuracy compared to not using one ("No LLM"). However, combining the LLM with confidence-based methods ("LLM + Conf") can improve accuracy, particularly when using the "CT" confidence method, which performs similarly to "No LLM". The "Rand" and "Query" confidence methods do not appear to offer significant improvements over using the LLM alone. The violin plots reveal the distribution of accuracy scores, highlighting the variability in performance for each method. The presence of a tail extending down to 0.2 indicates that even the best methods can sometimes produce inaccurate results. The horizontal line at 0.5 provides a benchmark for assessing the overall performance of each method. The data suggests that the choice of confidence method is crucial when integrating LLMs into elementary math problem-solving.