\n
## Line Chart: Execution Time vs. Region Size
### Overview
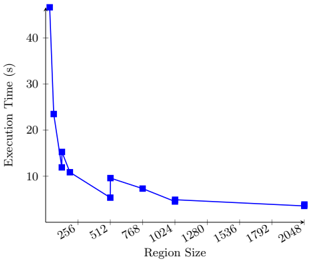
The image presents a line chart illustrating the relationship between Region Size and Execution Time. The chart shows a decreasing trend in execution time as the region size increases, with a steep initial drop followed by a gradual leveling off.
### Components/Axes
* **X-axis:** Region Size (labeled at the bottom). Scale ranges from approximately 256 to 2048, with markers at 256, 512, 768, 1024, 1280, 1536, 1792, and 2048.
* **Y-axis:** Execution Time (s) (labeled on the left). Scale ranges from approximately 0 to 45, with markers at 0, 10, 20, 30, and 40.
* **Data Series:** A single blue line representing the execution time for different region sizes.
* **No Legend:** There is no explicit legend, but the single line is the sole data representation.
### Detailed Analysis
The blue line starts at approximately 43 seconds at a region size of 256. The line then exhibits a steep downward slope, reaching approximately 24 seconds at a region size of 512. The slope continues to decrease, but at a slower rate, reaching approximately 12 seconds at a region size of 768. The line continues to descend, reaching approximately 8 seconds at a region size of 1024. From 1024 to 1536, the line decreases to approximately 7 seconds. Between 1536 and 1792, the line decreases to approximately 6 seconds. Finally, from 1792 to 2048, the line decreases to approximately 5 seconds.
Here's a more detailed breakdown of approximate data points:
* Region Size: 256, Execution Time: ~43 s
* Region Size: 512, Execution Time: ~24 s
* Region Size: 768, Execution Time: ~8 s
* Region Size: 1024, Execution Time: ~8 s
* Region Size: 1280, Execution Time: ~6 s
* Region Size: 1536, Execution Time: ~7 s
* Region Size: 1792, Execution Time: ~6 s
* Region Size: 2048, Execution Time: ~5 s
### Key Observations
* The most significant reduction in execution time occurs with smaller region sizes (256 to 768).
* As the region size increases beyond 1024, the decrease in execution time becomes marginal.
* The curve appears to be approaching an asymptote, suggesting that further increases in region size will yield diminishing returns in terms of execution time reduction.
### Interpretation
The data suggests that increasing the region size generally improves execution performance, but there's a point of diminishing returns. The initial steep decline indicates that smaller region sizes are significantly less efficient. This could be due to overhead associated with processing smaller regions, such as increased context switching or memory access costs. As the region size grows, these overheads become less significant, leading to a more gradual improvement in execution time. The leveling off of the curve suggests that the benefits of further increasing the region size are minimal, and may even be offset by other factors, such as increased memory usage or cache misses. This information is valuable for optimizing the performance of systems that process data in regions, as it helps determine the optimal region size to balance execution time and resource consumption. The chart implies that a region size of around 1024 or greater provides a good balance between performance and efficiency.