## Histogram: First Correct Answer Emergence
### Overview
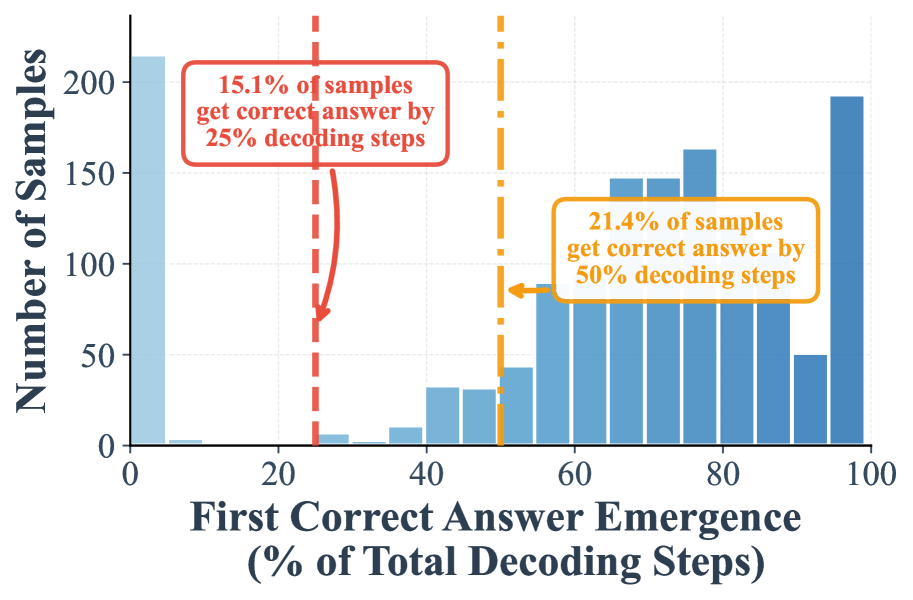
The image is a histogram showing the distribution of the "First Correct Answer Emergence" as a percentage of total decoding steps. The y-axis represents the number of samples, and the x-axis represents the percentage of total decoding steps at which the first correct answer emerges. There are two vertical lines indicating specific percentages of decoding steps (25% and 50%), with annotations indicating the percentage of samples that achieve a correct answer by those points.
### Components/Axes
* **Y-axis:** "Number of Samples", ranging from 0 to 200 in increments of 50.
* **X-axis:** "First Correct Answer Emergence (% of Total Decoding Steps)", ranging from 0 to 100 in increments of 20.
* **Vertical Dashed Red Line:** Located at approximately 25% on the x-axis.
* **Vertical Dash-Dot Orange Line:** Located at approximately 50% on the x-axis.
* **Annotation 1 (Red):** "15.1% of samples get correct answer by 25% decoding steps". An arrow points from the text box to the red dashed line.
* **Annotation 2 (Orange):** "21.4% of samples get correct answer by 50% decoding steps". An arrow points from the text box to the orange dash-dot line.
* **Histogram Bars:** The bars are light blue to blue, with the first bar being the lightest and the bars generally getting darker as the x-axis value increases.
### Detailed Analysis
* **Bar at 0%:** The first bar, representing 0% decoding steps, is the tallest, reaching approximately 215 samples.
* **Bars between 20% and 40%:** The bars in this range are very short, with values less than 10 samples.
* **Bars between 40% and 100%:** The bars generally increase in height as the percentage of decoding steps increases, with some fluctuations. The bar at 100% is the second tallest, reaching approximately 195 samples.
* **Red Dashed Line (25%):** The annotation indicates that 15.1% of samples get the correct answer by 25% of the decoding steps.
* **Orange Dash-Dot Line (50%):** The annotation indicates that 21.4% of samples get the correct answer by 50% of the decoding steps.
### Key Observations
* A significant number of samples (approximately 215) achieve the correct answer very early in the decoding process (0% of steps).
* The number of samples achieving the correct answer is relatively low between 20% and 40% of decoding steps.
* The number of samples achieving the correct answer generally increases as the percentage of decoding steps increases from 40% to 100%.
* A large number of samples (approximately 195) achieve the correct answer only at or near the end of the decoding process (100% of steps).
### Interpretation
The histogram suggests a bimodal distribution of "First Correct Answer Emergence." A substantial portion of samples gets the correct answer either very early (0% decoding steps) or very late (near 100% decoding steps). This could indicate two distinct strategies or behaviors in the decoding process. The annotations highlight that a relatively small percentage of samples achieve the correct answer at the 25% and 50% decoding step milestones. This suggests that for many samples, the correct answer emerges either very quickly or requires a significant portion of the decoding process.