\n
## Histogram: First Correct Answer Emergence
### Overview
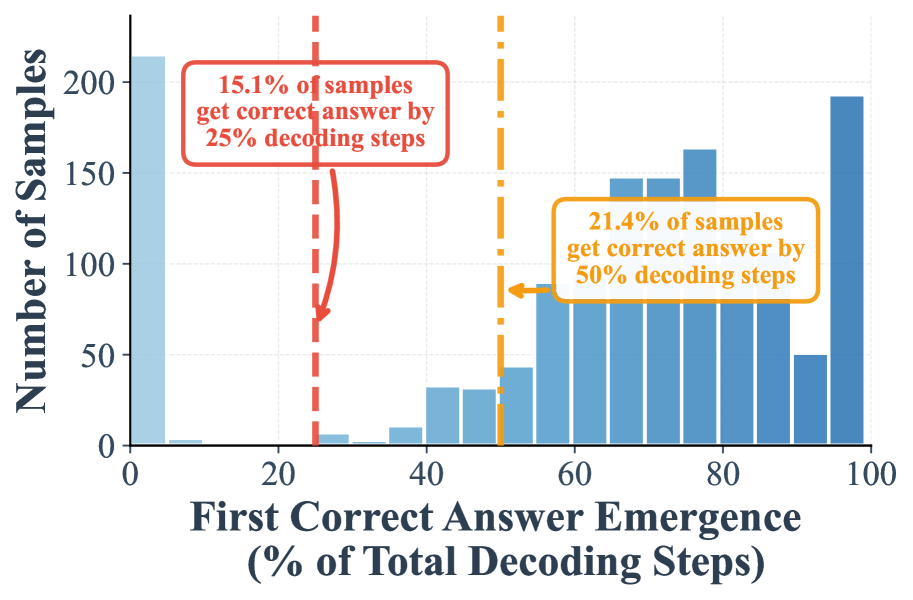
The image presents a histogram illustrating the distribution of the percentage of total decoding steps required for the first correct answer to emerge. The y-axis represents the number of samples, while the x-axis represents the percentage of total decoding steps. Two vertical lines with annotations highlight specific percentages: 25% and 50%.
### Components/Axes
* **X-axis Title:** "First Correct Answer Emergence (% of Total Decoding Steps)"
* Scale: 0 to 100, with increments of 10.
* **Y-axis Title:** "Number of Samples"
* Scale: 0 to 200, with increments of 50.
* **Annotations:**
* "15.1% of samples get correct answer by 25% decoding steps" (Red dashed line at approximately 20% on the x-axis)
* "21.4% of samples get correct answer by 50% decoding steps" (Yellow dotted line at approximately 50% on the x-axis)
### Detailed Analysis
The histogram shows a distribution of decoding step percentages. The data is grouped into bins of approximately 10% width.
* **0-20%:** Approximately 60 samples fall within this range, peaking around 15-20%.
* **20-30%:** Approximately 20 samples fall within this range.
* **30-40%:** Approximately 10 samples fall within this range.
* **40-50%:** Approximately 15 samples fall within this range.
* **50-60%:** Approximately 30 samples fall within this range.
* **60-70%:** Approximately 60 samples fall within this range.
* **70-80%:** Approximately 150 samples fall within this range.
* **80-90%:** Approximately 160 samples fall within this range.
* **90-100%:** Approximately 200 samples fall within this range.
The distribution is skewed to the right, with a large concentration of samples requiring a higher percentage of decoding steps to achieve the first correct answer.
### Key Observations
* The highest frequency of samples (around 200) requires 90-100% of decoding steps.
* A significant number of samples (around 160) requires 80-90% of decoding steps.
* The number of samples decreases as the percentage of decoding steps decreases, until reaching a peak around 15-20%.
* 15.1% of samples achieve a correct answer within the first 25% of decoding steps.
* 21.4% of samples achieve a correct answer within the first 50% of decoding steps.
### Interpretation
The data suggests that the process of obtaining a correct answer is often iterative and requires a substantial portion of the total decoding steps. The right-skewed distribution indicates that while some samples converge quickly, the majority require a more extensive decoding process. The annotations highlight that a relatively small percentage of samples achieve a correct answer early in the process, while a larger percentage requires a significant amount of decoding. This could indicate a complex problem space where initial attempts are often incorrect, and refinement through multiple decoding steps is necessary to arrive at the correct solution. The difference between the 25% and 50% milestones suggests that there is a diminishing return in terms of correct answer emergence as the decoding process progresses. The data could be used to optimize decoding strategies or to assess the efficiency of the decoding process.