## Heatmap: Model Performance Across Error Categories
### Overview
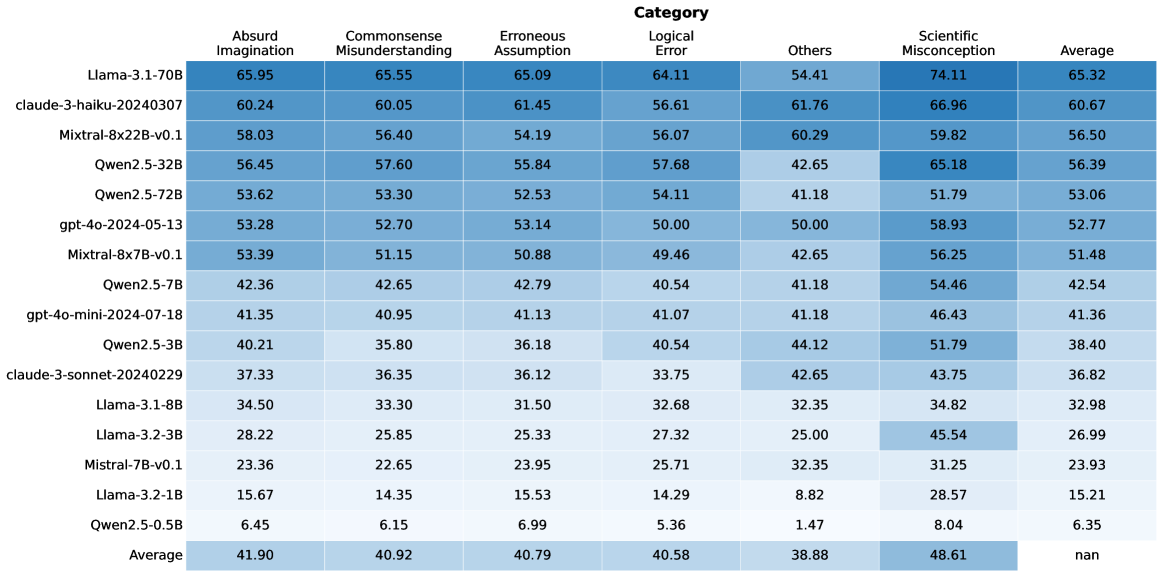
The image is a heatmap displaying the performance of various language models across different categories of errors. The rows represent the models, and the columns represent the error categories and the average performance. The cells are color-coded, with darker shades of blue indicating higher values.
### Components/Axes
* **Rows (Models):**
* Llama-3.1-70B
* claude-3-haiku-20240307
* Mixtral-8x22B-v0.1
* Qwen2.5-32B
* Qwen2.5-72B
* gpt-4o-2024-05-13
* Mixtral-8x7B-v0.1
* Qwen2.5-7B
* gpt-4o-mini-2024-07-18
* Qwen2.5-3B
* claude-3-sonnet-20240229
* Llama-3.1-8B
* Llama-3.2-3B
* Mistral-7B-v0.1
* Llama-3.2-1B
* Qwen2.5-0.5B
* Average
* **Columns (Error Categories):**
* Absurd Imagination
* Commonsense Misunderstanding
* Erroneous Assumption
* Logical Error
* Others
* Scientific Misconception
* Average
### Detailed Analysis or ### Content Details
Here's a breakdown of the data, row by row:
* **Llama-3.1-70B:** 65.95 (Absurd Imagination), 65.55 (Commonsense Misunderstanding), 65.09 (Erroneous Assumption), 64.11 (Logical Error), 54.41 (Others), 74.11 (Scientific Misconception), 65.32 (Average)
* **claude-3-haiku-20240307:** 60.24, 60.05, 61.45, 56.61, 61.76, 66.96, 60.67
* **Mixtral-8x22B-v0.1:** 58.03, 56.40, 54.19, 56.07, 60.29, 59.82, 56.50
* **Qwen2.5-32B:** 56.45, 57.60, 55.84, 57.68, 42.65, 65.18, 56.39
* **Qwen2.5-72B:** 53.62, 53.30, 52.53, 54.11, 41.18, 51.79, 53.06
* **gpt-4o-2024-05-13:** 53.28, 52.70, 53.14, 50.00, 50.00, 58.93, 52.77
* **Mixtral-8x7B-v0.1:** 53.39, 51.15, 50.88, 49.46, 42.65, 56.25, 51.48
* **Qwen2.5-7B:** 42.36, 42.65, 42.79, 40.54, 41.18, 54.46, 42.54
* **gpt-4o-mini-2024-07-18:** 41.35, 40.95, 41.13, 41.07, 41.18, 46.43, 41.36
* **Qwen2.5-3B:** 40.21, 35.80, 36.18, 40.54, 44.12, 51.79, 38.40
* **claude-3-sonnet-20240229:** 37.33, 36.35, 36.12, 33.75, 42.65, 43.75, 36.82
* **Llama-3.1-8B:** 34.50, 33.30, 31.50, 32.68, 32.35, 34.82, 32.98
* **Llama-3.2-3B:** 28.22, 25.85, 25.33, 27.32, 25.00, 45.54, 26.99
* **Mistral-7B-v0.1:** 23.36, 22.65, 23.95, 25.71, 32.35, 31.25, 23.93
* **Llama-3.2-1B:** 15.67, 14.35, 15.53, 14.29, 8.82, 28.57, 15.21
* **Qwen2.5-0.5B:** 6.45, 6.15, 6.99, 5.36, 1.47, 8.04, 6.35
* **Average:** 41.90, 40.92, 40.79, 40.58, 38.88, 48.61, nan
### Key Observations
* **Top Performers:** Llama-3.1-70B and claude-3-haiku-20240307 generally show higher values across most error categories.
* **Scientific Misconception:** Models tend to have higher values in the "Scientific Misconception" category compared to others.
* **Qwen2.5-0.5B:** This model consistently has the lowest values across all error categories.
* **Average Row:** The average performance across models is highest for "Scientific Misconception" (48.61) and lowest for "Others" (38.88). The overall average is marked as "nan".
### Interpretation
The heatmap provides a comparative analysis of language model performance based on error types. The darker shades indicate areas where models struggle more. The "Scientific Misconception" category appears to be a common challenge for these models. The Llama-3.1-70B and claude-3-haiku-20240307 models seem to perform better overall, while Qwen2.5-0.5B lags behind. The average row highlights the general trends in error categories across all models. The "nan" value for the average of averages suggests that this metric might not be meaningful or was not calculated correctly.