## Line Chart: GPU Throughput vs. k
### Overview
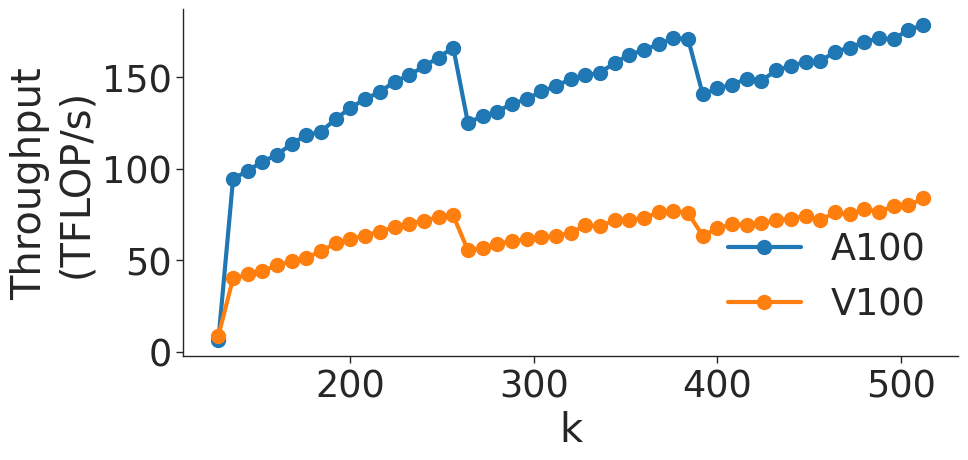
This image displays a line chart comparing the computational throughput (measured in TFLOP/s) of two NVIDIA GPU architectures, the A100 and the V100, across a range of values for a variable labeled 'k'. The chart illustrates a distinct "sawtooth" performance pattern for both hardware units, indicating periodic efficiency fluctuations.
### Components/Axes
* **Y-Axis:** Labeled "Throughput (TFLOP/s)". The scale ranges from 0 to 150+, with major grid markers at 0, 50, 100, and 150.
* **X-Axis:** Labeled "k". The scale ranges from approximately 50 to 512, with major grid markers at 200, 300, 400, and 500.
* **Legend:** Located in the bottom-right quadrant of the chart area.
* **Blue line with circular markers:** Labeled "A100".
* **Orange line with circular markers:** Labeled "V100".
### Detailed Analysis
The chart displays two data series, both exhibiting a repeating sawtooth trend: a steady upward slope followed by a sharp, vertical drop, repeating twice across the x-axis.
**1. A100 (Blue Series)**
* **Trend:** The A100 consistently maintains higher throughput than the V100.
* **Data Points:**
* Starts at approximately 95 TFLOP/s at k ≈ 60.
* Increases steadily to a peak of ~165 TFLOP/s at k ≈ 260.
* Drops sharply to ~125 TFLOP/s.
* Increases steadily to a peak of ~175 TFLOP/s at k ≈ 390.
* Drops sharply to ~140 TFLOP/s.
* Increases steadily to a final peak of ~180 TFLOP/s at k ≈ 512.
**2. V100 (Orange Series)**
* **Trend:** The V100 follows the same structural pattern as the A100 but at a lower absolute throughput.
* **Data Points:**
* Starts at approximately 10 TFLOP/s at k ≈ 60.
* Increases steadily to a peak of ~75 TFLOP/s at k ≈ 260.
* Drops sharply to ~55 TFLOP/s.
* Increases steadily to a peak of ~78 TFLOP/s at k ≈ 390.
* Drops sharply to ~65 TFLOP/s.
* Increases steadily to a final peak of ~85 TFLOP/s at k ≈ 512.
### Key Observations
* **Synchronized Drops:** The sharp performance drops occur at the exact same x-axis values (k ≈ 260 and k ≈ 390) for both GPU models. This indicates that the performance bottleneck is tied to the input parameter 'k' rather than the specific GPU architecture.
* **Performance Gap:** The A100 consistently provides more than double the throughput of the V100 across the entire range of 'k'.
* **Scaling:** Despite the periodic drops, both GPUs show a general upward trend in throughput as 'k' increases.
### Interpretation
The data suggests this chart represents the performance of a matrix multiplication or tensor operation kernel on GPUs.
The "sawtooth" pattern is a classic indicator of **tiling or memory alignment issues**. In GPU computing, operations are often broken into "tiles" or blocks of a fixed size (e.g., 256 or 384).
* When 'k' is a multiple of the tile size, the GPU achieves peak efficiency because the workload fits perfectly into the hardware's execution units.
* When 'k' increases slightly beyond a tile boundary, the GPU must process a "remainder" or an incomplete tile, which is significantly less efficient, causing the sharp drop in throughput.
This visualization is critical for software engineers and researchers optimizing deep learning models; it demonstrates that choosing specific values for 'k' (e.g., batch sizes or hidden layer dimensions) can result in massive performance swings. To maximize hardware utilization, one should align 'k' with the hardware's optimal tile sizes to avoid these "cliffs."