## Line Chart: Throughput Comparison of A100 vs V100 GPUs
### Overview
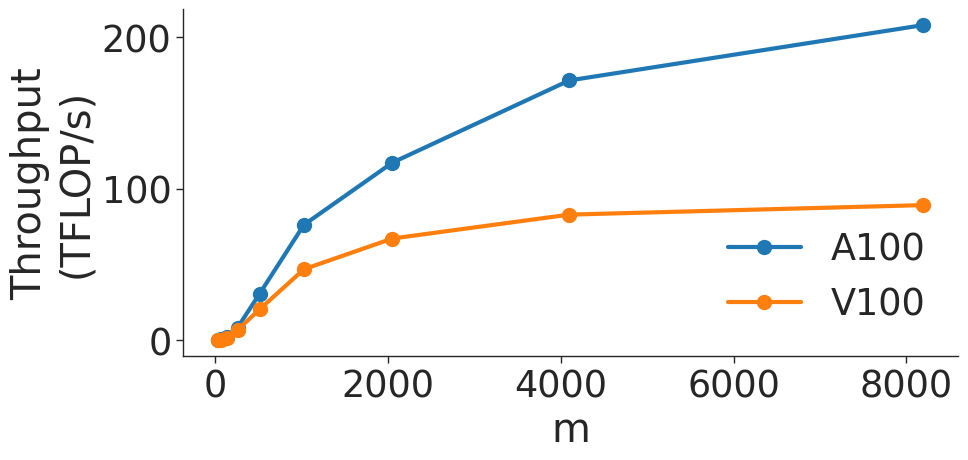
This image displays a line chart comparing the computational throughput (measured in TFLOP/s) of two NVIDIA GPU architectures, the A100 and the V100, across a range of input sizes denoted by the variable 'm'. The chart demonstrates that the A100 architecture achieves significantly higher throughput than the V100 as the input size increases.
### Components/Axes
* **Y-Axis:** Labeled "Throughput (TFLOP/s)". The scale starts at 0 and increases to 200, with major tick marks at 0, 100, and 200.
* **X-Axis:** Labeled "m". The scale starts at 0 and increases to 8000, with major tick marks at 0, 2000, 4000, 6000, and 8000.
* **Legend:** Located in the bottom-right quadrant of the chart area.
* **Blue Line:** Labeled "A100" (represented by blue circular markers).
* **Orange Line:** Labeled "V100" (represented by orange circular markers).
### Detailed Analysis
The X-axis data points appear to follow a logarithmic progression (likely powers of 2: 64, 128, 256, 512, 1024, 2048, 4096, 8192).
**Trend Verification:**
* **A100 (Blue Line):** The line slopes upward consistently from left to right. The slope is steepest between m=512 and m=4096, indicating rapid performance scaling.
* **V100 (Orange Line):** The line slopes upward but exhibits a diminishing rate of return (concave shape), flattening out significantly as 'm' increases beyond 4096.
**Data Extraction (Approximate Values):**
| Input Size (m) | A100 Throughput (TFLOP/s) | V100 Throughput (TFLOP/s) |
| :--- | :--- | :--- |
| ~1024 | ~75 | ~50 |
| ~2048 | ~120 | ~65 |
| ~4096 | ~170 | ~85 |
| ~8192 | ~210 | ~90 |
*Note: Values are estimated based on visual alignment with the Y-axis grid lines.*
### Key Observations
* **Performance Gap:** At low values of 'm' (near 0), the performance difference between the two GPUs is negligible. As 'm' increases, the gap widens dramatically.
* **Scaling Efficiency:** The A100 continues to scale its throughput effectively up to the maximum tested value (m=8192).
* **Saturation Point:** The V100 appears to reach a performance saturation point or "plateau" around m=4096, where throughput gains become marginal (increasing only slightly from ~85 to ~90 TFLOP/s by m=8192).
### Interpretation
This chart likely represents a benchmark of a compute-intensive operation, such as matrix multiplication (GEMM), where throughput is highly dependent on the size of the input matrices.
* **Architectural Superiority:** The A100 architecture demonstrates superior hardware utilization and memory bandwidth compared to the V100 for larger workloads.
* **Bottlenecks:** The flattening of the V100 curve suggests that it hits a hardware bottleneck (likely memory bandwidth or compute unit saturation) much earlier than the A100.
* **Use Case Implications:** For small batch sizes or small matrix operations, the choice of GPU may not significantly impact performance. However, for large-scale deep learning or scientific computing tasks (high 'm'), the A100 provides a substantial performance advantage, more than doubling the throughput of the V100 at the highest tested input size.