## Line Graph: Task Loss Values Across Epochs
### Overview
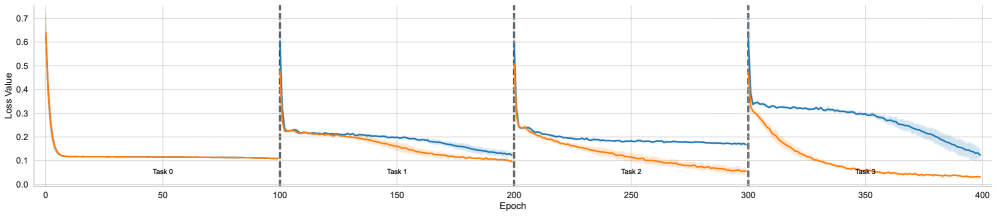
The image is a line graph depicting the loss values of multiple tasks over training epochs. The graph includes two data series (orange and blue) with shaded uncertainty regions, and vertical dashed lines marking task boundaries. The x-axis represents epochs (0–400), while the y-axis shows loss values (0–0.7). Tasks are labeled sequentially (Task 0–Task 3) along the x-axis.
---
### Components/Axes
- **X-axis**: Epochs (0–400), segmented by vertical dashed lines at 100, 200, 300, and 400. Labels indicate "Task 0," "Task 1," "Task 2," and "Task 3" at these intervals.
- **Y-axis**: Loss Value (0–0.7), with gridlines for precision.
- **Legend**: Located at the bottom-right. Orange corresponds to "Task 0," and blue corresponds to "Task 1." No legend entries for Tasks 2 or 3.
- **Shaded Regions**: Gray bands around lines indicate uncertainty (standard deviation or confidence intervals).
---
### Detailed Analysis
1. **Task 0 (Orange Line)**:
- **Initial Drop**: Loss plunges from ~0.6 to ~0.1 within the first 50 epochs.
- **Plateau**: Stabilizes near 0.1 for the remainder of the training (epochs 50–400).
- **Uncertainty**: Shaded region narrows sharply during the drop, then widens slightly post-50 epochs.
2. **Task 1 (Blue Line)**:
- **Initial Drop**: Loss decreases from ~0.6 to ~0.2 within the first 100 epochs.
- **Fluctuation**: Gradual decline to ~0.15 by epoch 200, followed by minor oscillations.
- **Uncertainty**: Shaded region remains relatively stable after the initial drop.
3. **Tasks 2 and 3**:
- **No Data Series**: Despite x-axis labels for Tasks 2 and 3, no corresponding lines or shaded regions are present in the graph.
- **Legend Discrepancy**: The legend only includes Tasks 0 and 1, suggesting incomplete or missing data for later tasks.
---
### Key Observations
- **Sharp Initial Convergence**: Both Task 0 and Task 1 exhibit rapid loss reduction in their respective training phases.
- **Task-Specific Plateaus**: Loss values stabilize after initial drops, indicating task-specific convergence.
- **Missing Data**: Tasks 2 and 3 are labeled on the x-axis but lack visual representation, creating ambiguity.
- **Uncertainty Patterns**: Task 0 shows higher uncertainty post-convergence compared to Task 1.
---
### Interpretation
The graph illustrates a multi-task learning scenario where tasks are trained sequentially (100 epochs per task). Task 0 converges faster and achieves lower loss than Task 1, suggesting differences in task complexity or model adaptability. The absence of data for Tasks 2 and 3 raises questions about data completeness or visualization errors. The shaded uncertainty regions highlight variability in model performance, with Task 0 exhibiting greater instability after convergence. This could indicate challenges in maintaining task-specific knowledge over time, potentially pointing to issues like catastrophic forgetting in sequential training.