\n
## Diagram: Monte Carlo Tree Search (MCTS) Process
### Overview
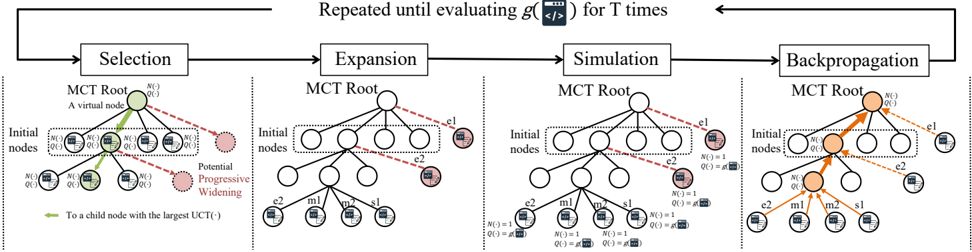
The image depicts a diagram illustrating the four main stages of the Monte Carlo Tree Search (MCTS) algorithm: Selection, Expansion, Simulation, and Backpropagation. The diagram shows a tree-like structure representing the search space, with nodes representing game states and edges representing possible actions. The process is repeated until a specified condition (evaluating g(<b>) for T times) is met.
### Components/Axes
The diagram is divided into four sections, each representing a stage of MCTS. Each section contains a tree diagram. The trees share a common structure, with "Initial nodes" at the top and branching nodes representing subsequent states. Labels within the nodes indicate state information (e.g., N(s), Q(s), UCT). Arrows indicate the flow of the algorithm. A legend is provided at the bottom-left, explaining the meaning of the green arrow.
### Detailed Analysis or Content Details
**1. Selection:**
* The title "Selection" is positioned at the top-left of the section.
* The tree is labeled "MCT Root" at the top.
* Nodes are labeled with "N(s)" and "Q(s)".
* A green arrow originates from a node labeled "N(s)" and points to a child node labeled "Q(s)". The legend states: "To a child node with the largest UCT(i)".
* Several nodes are highlighted in pink, indicating they are being considered.
* A dashed red arrow labeled "Potential Progressive Widening" points to a lower level of the tree.
**2. Expansion:**
* The title "Expansion" is positioned at the top-center of the section.
* The tree is labeled "MCT Root" at the top.
* Nodes are labeled with "e1" and "e2".
* A dashed red arrow labeled "Potential Progressive Widening" points to a lower level of the tree.
**3. Simulation:**
* The title "Simulation" is positioned at the top-center of the section.
* The tree is labeled "MCT Root" at the top.
* Nodes are labeled with "N(s) = 1", "Q(s) = x", "s1", and "m1".
* Text within nodes: "r(s) = 1", "q(s) = x", "r(s) = 1", "q(s) = x".
**4. Backpropagation:**
* The title "Backpropagation" is positioned at the top-right of the section.
* The tree is labeled "MCT Root" at the top.
* Nodes are labeled with "e2", "m2", and "s1".
* An orange arrow indicates the backpropagation path.
* A node is highlighted in orange.
**Overall Flow:**
* A curved arrow connects the four sections, indicating the iterative nature of the MCTS algorithm.
* The text "Repeated until evaluating g(<b>) for T times" is positioned above the curved arrow.
### Key Observations
* The diagram visually represents the iterative process of MCTS, highlighting how the search tree expands and is updated with simulation results.
* The use of color-coding (green, orange, pink) helps to emphasize the different stages and actions within the algorithm.
* The labels within the nodes provide information about the state of the search process.
### Interpretation
The diagram illustrates the core loop of the Monte Carlo Tree Search algorithm. The algorithm begins with a selection phase, where it traverses the tree to choose the most promising node based on the Upper Confidence Bound 1 applied to Trees (UCT) value. This is indicated by the green arrow. The expansion phase then adds a new node to the tree, representing a possible action from the selected node. Next, a simulation phase is performed, where a random playout is conducted from the newly expanded node to estimate the value of that state. Finally, the backpropagation phase updates the statistics of the nodes along the path from the expanded node back to the root, using the result of the simulation. This process is repeated iteratively until a stopping criterion is met, such as reaching a maximum number of simulations (T). The diagram effectively conveys the interplay between exploration (expanding new nodes) and exploitation (selecting nodes with high estimated values) that characterizes MCTS. The labels within the nodes (N(s), Q(s), r(s), q(s)) represent the number of visits, average reward, reward from the simulation, and estimated value, respectively. The progressive widening aspect suggests a strategy to balance exploration and exploitation by selectively expanding nodes.