## Line Chart: CIFAR-100 Test Accuracy vs. Number of Classes
### Overview
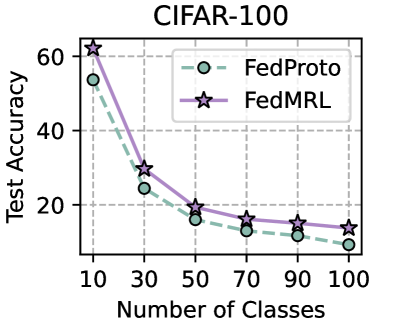
The image is a line chart comparing the test accuracy of two models, FedProto and FedMRL, across varying numbers of classes in the CIFAR-100 dataset. The x-axis represents the number of classes, and the y-axis represents the test accuracy.
### Components/Axes
* **Title:** CIFAR-100
* **X-axis:** Number of Classes, with tick marks at 10, 30, 50, 70, 90, and 100.
* **Y-axis:** Test Accuracy, with tick marks at 20, 40, and 60.
* **Legend:** Located in the top-right corner.
* FedProto: Represented by a dashed light green line with circle markers.
* FedMRL: Represented by a solid light purple line with star markers.
* **Grid:** Dashed gray lines provide a visual grid.
### Detailed Analysis
**FedProto (Dashed Light Green Line with Circle Markers):**
* **Trend:** The test accuracy decreases as the number of classes increases.
* **Data Points:**
* 10 Classes: Approximately 54%
* 30 Classes: Approximately 24%
* 50 Classes: Approximately 16%
* 70 Classes: Approximately 13%
* 90 Classes: Approximately 11%
* 100 Classes: Approximately 8%
**FedMRL (Solid Light Purple Line with Star Markers):**
* **Trend:** The test accuracy decreases as the number of classes increases.
* **Data Points:**
* 10 Classes: Approximately 62%
* 30 Classes: Approximately 31%
* 50 Classes: Approximately 19%
* 70 Classes: Approximately 16%
* 90 Classes: Approximately 14%
* 100 Classes: Approximately 13%
### Key Observations
* Both FedProto and FedMRL models exhibit a decline in test accuracy as the number of classes increases.
* FedMRL consistently outperforms FedProto across all tested numbers of classes.
* The most significant drop in accuracy for both models occurs between 10 and 30 classes.
* The rate of accuracy decrease slows down as the number of classes increases beyond 50.
### Interpretation
The chart illustrates the performance of two federated learning models, FedProto and FedMRL, on the CIFAR-100 dataset. The decreasing test accuracy with an increasing number of classes suggests that both models struggle to maintain performance as the classification task becomes more complex. FedMRL's consistently higher accuracy indicates that it is a more robust model for this particular task and dataset. The steep initial decline in accuracy highlights the challenge of distinguishing between a larger number of classes, while the subsequent plateau suggests a limit to the performance degradation as the number of classes continues to increase.