\n
## Diagram: Level of Detail (LOD) Comparison
### Overview
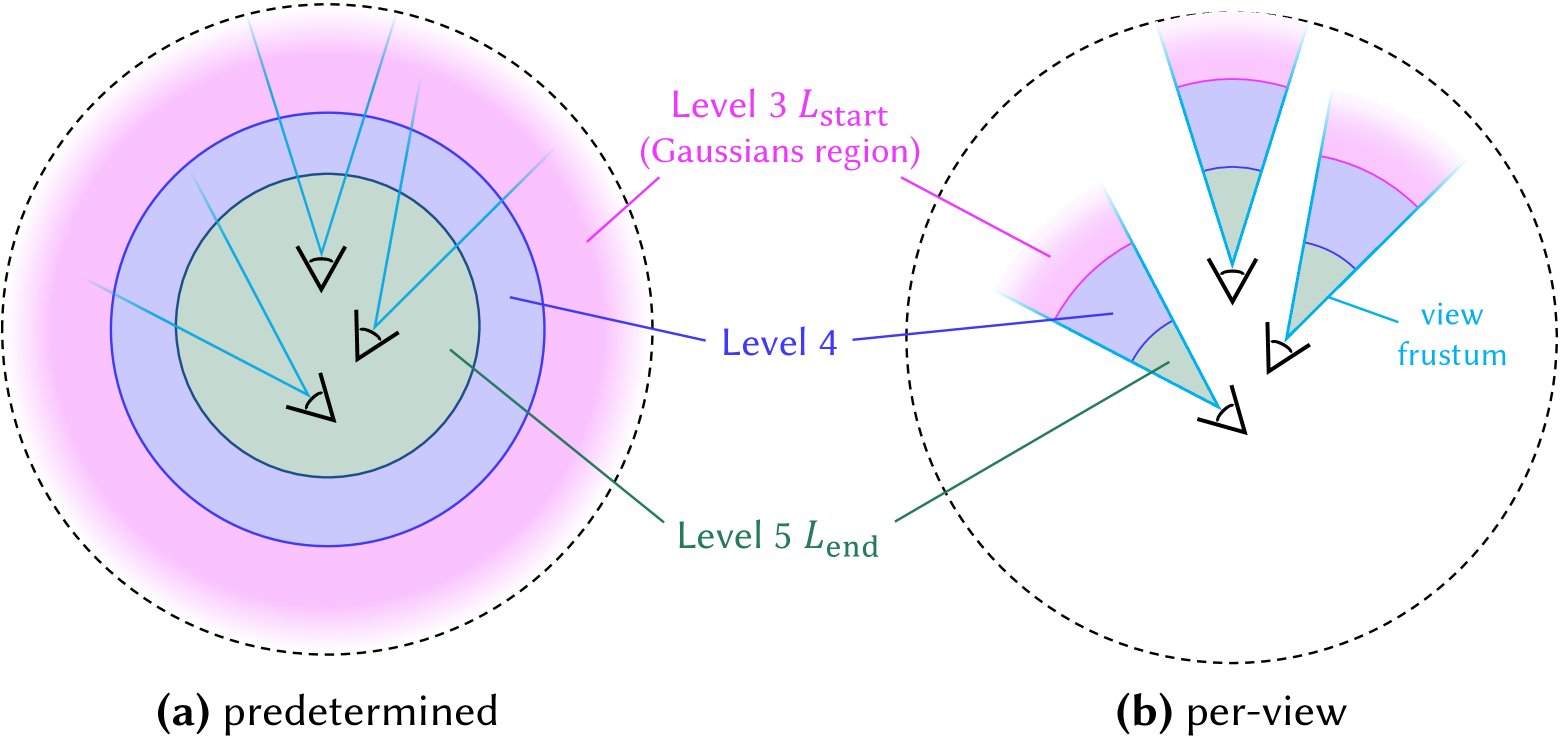
The image presents a comparative diagram illustrating two approaches to Level of Detail (LOD) management: "(a) predetermined" and "(b) per-view". Both approaches utilize concentric, shaded circles to represent LOD levels, and rays emanating from camera positions to demonstrate the visibility of different detail levels. The diagram focuses on the spatial relationship between camera views, LOD levels, and the "view frustum".
### Components/Axes
The diagram consists of two main sections, labeled "(a) predetermined" and "(b) per-view", separated by a dashed vertical line. Each section contains:
* **Concentric Circles:** Representing LOD levels. The levels are labeled "Level 3 Lstart (Gaussians region)", "Level 4", and "Level 5 Lend".
* **Rays:** Emanating from camera positions (represented by inverted triangles) indicating the field of view. These rays intersect the concentric circles.
* **Shading:** The circles are shaded with varying intensities of purple, indicating the LOD level.
* **View Frustum:** A teal-colored wedge shape in section (b), representing the visible area from a camera's perspective.
* **Labels:** Text annotations describing the LOD levels and the overall approach.
### Detailed Analysis or Content Details
**Section (a) Predetermined:**
* Three concentric circles are present, shaded in purple.
* The innermost circle is labeled "Level 3 Lstart (Gaussians region)".
* The middle circle is labeled "Level 4".
* The outermost circle is labeled "Level 5 Lend".
* Three cameras (inverted triangles) are positioned within the innermost circle (Level 3).
* Rays emanate from each camera, extending outwards and intersecting all three LOD levels. The rays are colored pink.
* The rays are evenly distributed, suggesting a uniform LOD selection based on distance.
**Section (b) Per-view:**
* Three concentric circles are present, shaded in purple. The levels are the same as in section (a).
* Three cameras (inverted triangles) are positioned at varying distances from the center.
* Rays emanate from each camera, but their lengths vary.
* The rays from the closest camera intersect only Level 3 and Level 4.
* The rays from the middle camera intersect Level 4 and Level 5.
* The rays from the furthest camera intersect only Level 5.
* A teal wedge labeled "view frustum" is overlaid on the rays, indicating the visible area.
* The rays are colored pink and green.
### Key Observations
* The "predetermined" approach (a) applies the same LOD to all cameras, regardless of their distance.
* The "per-view" approach (b) dynamically adjusts the LOD based on the camera's distance and view frustum.
* The "Gaussians region" label suggests that Level 3 might be calculated using a Gaussian distribution.
* The LOD levels increase numerically (3 to 5) as the detail level decreases.
* The dashed circles surrounding both sections indicate a common spatial boundary.
### Interpretation
This diagram illustrates the difference between a static, predetermined LOD system and a dynamic, per-view LOD system. The predetermined approach is simpler to implement but can lead to overdraw (rendering unnecessary detail for distant objects) or underdraw (rendering insufficient detail for close objects). The per-view approach is more complex but optimizes rendering performance by only rendering the appropriate level of detail for each camera's view. The "Gaussians region" label suggests a potential method for calculating LOD transitions, possibly smoothing the visual changes between levels. The diagram highlights the trade-offs between simplicity and efficiency in LOD management, and demonstrates how a per-view approach can improve rendering performance by adapting to the specific needs of each camera. The use of the "view frustum" emphasizes the importance of only rendering objects within the visible area.