## Scatter Plot: Cognitive Task Distribution in PC1 and PC2 Space
### Overview
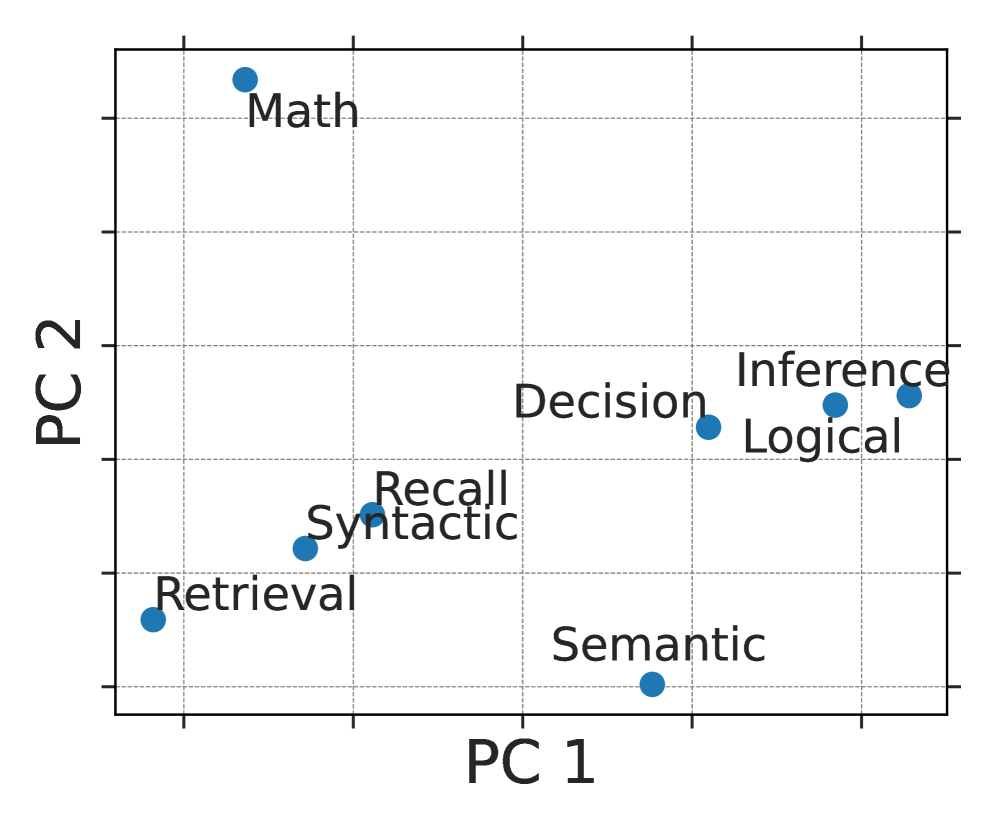
The image is a scatter plot displaying the distribution of various cognitive tasks in a two-dimensional space defined by Principal Component 1 (PC1) and Principal Component 2 (PC2). Each task is represented by a blue dot, with its position indicating its relative loading on the two principal components. The plot provides a visual representation of the relationships and distinctions between these cognitive tasks based on their underlying cognitive demands.
### Components/Axes
* **X-axis (PC1):** Labeled "PC 1". The axis ranges from approximately -1 to 1, with no explicit numerical markers.
* **Y-axis (PC2):** Labeled "PC 2". The axis ranges from approximately -1 to 1, with no explicit numerical markers.
* **Data Points:** Each data point is a blue circle representing a cognitive task.
* **Gridlines:** Gray dashed gridlines are present to aid in visually estimating the coordinates of each data point.
### Detailed Analysis or ### Content Details
The following cognitive tasks are plotted:
* **Math:** Located in the top-left quadrant, with approximate coordinates of PC1 = -0.7, PC2 = 0.8.
* **Retrieval:** Located in the bottom-left quadrant, with approximate coordinates of PC1 = -0.8, PC2 = -0.4.
* **Syntactic:** Located slightly to the left of the center, with approximate coordinates of PC1 = -0.5, PC2 = -0.2.
* **Recall:** Located slightly to the left of the center, with approximate coordinates of PC1 = -0.4, PC2 = -0.1.
* **Semantic:** Located in the bottom-right quadrant, with approximate coordinates of PC1 = 0.2, PC2 = -0.7.
* **Decision:** Located in the top-right quadrant, with approximate coordinates of PC1 = 0.1, PC2 = 0.4.
* **Inference:** Located in the top-right quadrant, with approximate coordinates of PC1 = 0.6, PC2 = 0.5.
* **Logical:** Located in the top-right quadrant, with approximate coordinates of PC1 = 0.7, PC2 = 0.4.
### Key Observations
* **Clustering:** The tasks "Inference" and "Logical" are clustered closely together in the top-right quadrant. The tasks "Recall" and "Syntactic" are also clustered together, slightly to the left of the center.
* **Distribution:** The tasks are distributed across all four quadrants, indicating that PC1 and PC2 capture different aspects of cognitive processing.
* **Extreme Points:** "Math" has a high PC2 value and a low PC1 value, while "Semantic" has a low PC2 value and a slightly positive PC1 value.
### Interpretation
The scatter plot visualizes the relationships between different cognitive tasks based on their loadings on the first two principal components (PC1 and PC2). The proximity of tasks in the plot suggests that they share similar cognitive demands as captured by these principal components. For example, "Inference" and "Logical" tasks being close together suggests they load similarly on PC1 and PC2, potentially indicating shared cognitive processes. "Math" and "Semantic" are located in opposite quadrants, suggesting that they rely on different cognitive processes as captured by PC1 and PC2. The plot provides a dimensionality reduction of the cognitive tasks, allowing for a simplified comparison of their underlying cognitive requirements.