TECHNICAL ASSET FINGERPRINT
653f858611a3046ff0444958
Click to view fullscreen
Press ESC or click to close
FOUND IN PAPERS
EXPERT: healer-alpha-free VERSION 1
RUNTIME: free/openrouter/healer-alpha
INTEL_VERIFIED
## Heatmap: Cross-Dataset Performance Matrix
### Overview
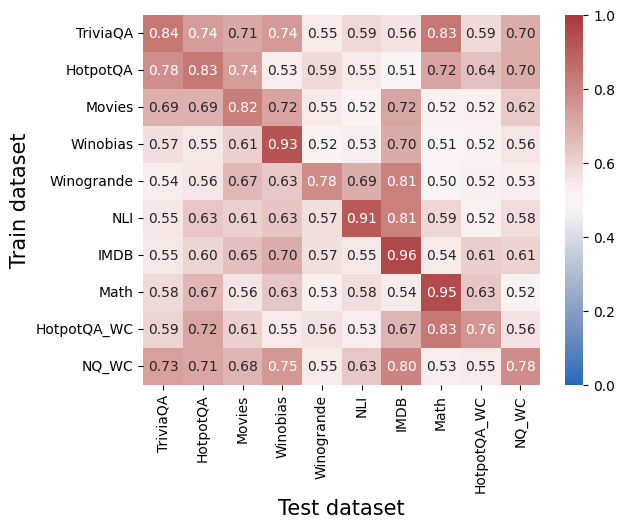
The image is a heatmap visualizing a square matrix of numerical values, likely representing performance scores (e.g., accuracy, F1, or transferability metric) between different machine learning datasets. The matrix compares models trained on one dataset (y-axis) and tested on another (x-axis). All values are between 0.50 and 0.96, indicated by a color gradient from light pink/beige (lower values) to dark red (higher values). The color bar legend on the right confirms the scale ranges from 0.0 (blue) to 1.0 (dark red), though no blue values appear in this specific matrix.
### Components/Axes
* **Chart Type:** Heatmap (Confusion Matrix style).
* **Y-Axis (Vertical):** Labeled **"Train dataset"**. Categories from top to bottom:
1. TriviaQA
2. HotpotQA
3. Movies
4. Winobias
5. Winogrande
6. NLI
7. IMDB
8. Math
9. HotpotQA_WC
10. NQ_WC
* **X-Axis (Horizontal):** Labeled **"Test dataset"**. Categories from left to right (identical to y-axis):
1. TriviaQA
2. HotpotQA
3. Movies
4. Winobias
5. Winogrande
6. NLI
7. IMDB
8. Math
9. HotpotQA_WC
10. NQ_WC
* **Legend/Color Bar:** Positioned vertically on the **right side** of the chart. It maps color intensity to numerical values, with a scale from **0.0 (blue)** at the bottom to **1.0 (dark red)** at the top. Tick marks are at 0.0, 0.2, 0.4, 0.6, 0.8, and 1.0.
* **Data Cells:** A 10x10 grid. Each cell contains a numerical value (to two decimal places) and is colored according to the legend.
### Detailed Analysis
The following table reconstructs the matrix. Values are read as the score for the model trained on the **Row Dataset** and tested on the **Column Dataset**.
| Train \ Test | TriviaQA | HotpotQA | Movies | Winobias | Winogrande | NLI | IMDB | Math | HotpotQA_WC | NQ_WC |
| :--- | :---: | :---: | :---: | :---: | :---: | :---: | :---: | :---: | :---: | :---: |
| **TriviaQA** | **0.84** | 0.74 | 0.71 | 0.74 | 0.55 | 0.59 | 0.56 | 0.83 | 0.59 | 0.70 |
| **HotpotQA** | 0.78 | **0.83** | 0.74 | 0.53 | 0.59 | 0.55 | 0.51 | 0.72 | 0.64 | 0.70 |
| **Movies** | 0.69 | 0.69 | **0.82** | 0.72 | 0.55 | 0.52 | 0.72 | 0.52 | 0.52 | 0.62 |
| **Winobias** | 0.57 | 0.55 | 0.61 | **0.93** | 0.52 | 0.53 | 0.70 | 0.51 | 0.52 | 0.56 |
| **Winogrande** | 0.54 | 0.56 | 0.67 | 0.63 | **0.78** | 0.69 | 0.81 | 0.50 | 0.52 | 0.53 |
| **NLI** | 0.55 | 0.63 | 0.61 | 0.63 | 0.57 | **0.91** | 0.81 | 0.59 | 0.52 | 0.58 |
| **IMDB** | 0.55 | 0.60 | 0.65 | 0.70 | 0.57 | 0.55 | **0.96** | 0.54 | 0.61 | 0.61 |
| **Math** | 0.58 | 0.67 | 0.56 | 0.63 | 0.53 | 0.58 | 0.54 | **0.95** | 0.63 | 0.52 |
| **HotpotQA_WC** | 0.59 | 0.72 | 0.61 | 0.55 | 0.56 | 0.53 | 0.67 | **0.83** | **0.76** | 0.56 |
| **NQ_WC** | 0.73 | 0.71 | 0.68 | 0.75 | 0.55 | 0.63 | 0.80 | 0.53 | 0.55 | **0.78** |
**Trend Verification:**
* **Diagonal Trend:** The cells where the train and test dataset are identical (the main diagonal from top-left to bottom-right) consistently show the highest values in their respective rows, forming a dark red diagonal line. This indicates models perform best when evaluated on the same dataset they were trained on.
* **Off-Diagonal Trends:** Performance generally drops for cross-dataset evaluation, but significant variation exists. Some dataset pairs show relatively high transfer (e.g., NLI→IMDB: 0.81, HotpotQA_WC→Math: 0.83), while others show low transfer (e.g., Winogrande→Math: 0.50, Winobias→Math: 0.51).
### Key Observations
1. **Highest Performance:** The single highest value in the matrix is **0.96**, for a model trained and tested on **IMDB**. The next highest are **0.95** (Math→Math) and **0.93** (Winobias→Winobias).
2. **Strongest Cross-Dataset Transfer:** Notable high off-diagonal values include:
* **NLI → IMDB:** 0.81
* **HotpotQA_WC → Math:** 0.83
* **TriviaQA → Math:** 0.83
* **NQ_WC → IMDB:** 0.80
3. **Weakest Cross-Dataset Transfer:** The lowest values (around 0.50-0.53) often involve the **Math** and **Winogrande** datasets as either train or test targets, suggesting these domains are less transferable to or from others.
4. **Dataset Clusters:** Some datasets show similar performance profiles. For example, **TriviaQA** and **HotpotQA** (and their _WC variants) have moderately high scores with each other, suggesting they share similar task characteristics. **NLI** and **IMDB** also show a strong mutual transfer (0.81 and 0.55, respectively).
### Interpretation
This heatmap provides a quantitative map of **transfer learning effectiveness** or **domain similarity** across ten distinct NLP datasets. The data suggests:
* **Domain Specificity is Dominant:** The strong diagonal confirms that models are highly specialized to the data distribution and task format of their training set. This is the primary factor in performance.
* **Underlying Task Similarity:** High off-diagonal values reveal latent relationships between datasets. For instance, the strong transfer between **NLI** (Natural Language Inference) and **IMDB** (sentiment analysis) might indicate that the logical reasoning skills learned for NLI are beneficial for discerning sentiment in movie reviews. Similarly, the transfer between **TriviaQA** and **Math** could suggest shared skills in information retrieval and structured problem-solving.
* **The "_WC" Suffix:** The datasets `HotpotQA_WC` and `NQ_WC` likely represent variants of their parent datasets (HotpotQA and Natural Questions) with a specific modification (e.g., "Without Context" or "Web Content"). Their performance patterns are similar to but distinct from their parent datasets, showing how data preprocessing or format changes impact transferability.
* **Practical Implication:** For a practitioner, this matrix is a guide for model selection and data strategy. If you have a model trained on `NLI`, it may perform reasonably well on `IMDB` without fine-tuning. Conversely, a model trained on `Winogrande` would likely require significant adaptation to perform well on `Math`. The matrix helps identify which source datasets might be good proxies for pre-training when target domain data is scarce.
**In summary, the image is not just a performance report but a diagnostic tool revealing the landscape of task relationships and knowledge transfer within this set of NLP benchmarks.**
DECODING INTELLIGENCE...