## Line Chart: Benchmark Length vs. Number of Failed LLMs
### Overview
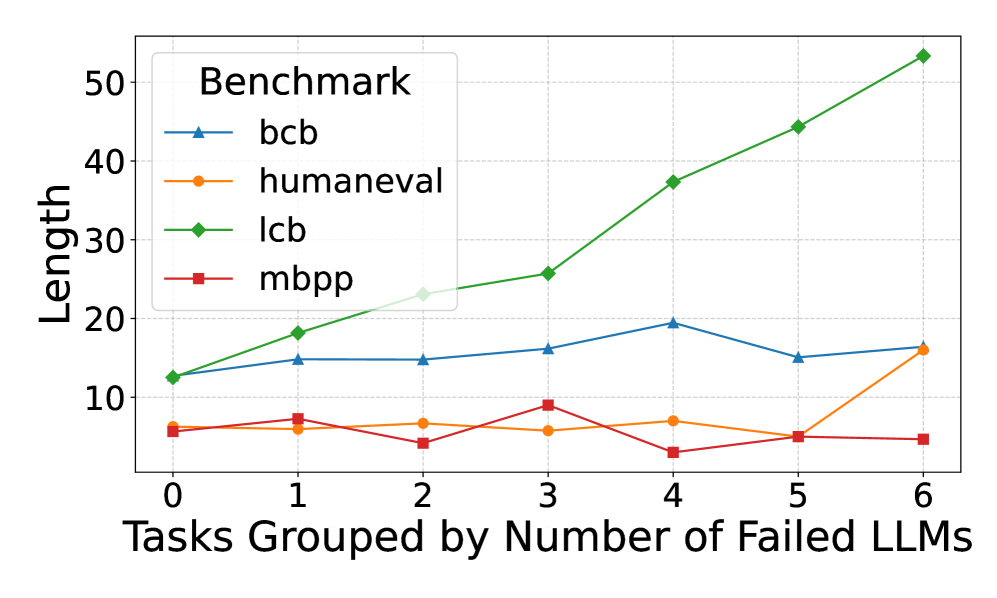
This is a line chart comparing the performance or characteristic labeled "Length" across four different benchmarks as a function of task difficulty. Task difficulty is quantified by grouping tasks based on the number of Large Language Models (LLMs) that failed to solve them. The chart suggests an analysis of how benchmark metrics correlate with inherent task difficulty.
### Components/Axes
* **Chart Title:** None visible at the top of the chart area. The primary label is the legend title.
* **Legend:** Located in the top-left corner of the chart area. It is titled "**Benchmark**" and contains four entries:
* `bcb`: Blue line with upward-pointing triangle markers.
* `humaneval`: Orange line with circle markers.
* `lcb`: Green line with diamond markers.
* `mbpp`: Red line with square markers.
* **X-Axis:**
* **Label:** "Tasks Grouped by Number of Failed LLMs"
* **Scale:** Linear, integer values from 0 to 6.
* **Ticks:** 0, 1, 2, 3, 4, 5, 6.
* **Y-Axis:**
* **Label:** "Length"
* **Scale:** Linear, ranging from approximately 0 to 55.
* **Ticks:** 10, 20, 30, 40, 50.
* **Grid:** A light gray grid is present, aligned with the major ticks on both axes.
### Detailed Analysis
The chart plots four data series. Below is a point-by-point extraction for each series, with values approximated from the grid.
**1. Series: `lcb` (Green line, diamond markers)**
* **Trend Verification:** This line shows a strong, consistent upward trend. It starts as the second-lowest value and ends as the highest by a significant margin.
* **Data Points:**
* x=0: y ≈ 12
* x=1: y ≈ 18
* x=2: y ≈ 23
* x=3: y ≈ 26
* x=4: y ≈ 37
* x=5: y ≈ 44
* x=6: y ≈ 53
**2. Series: `bcb` (Blue line, triangle markers)**
* **Trend Verification:** This line shows a moderate, generally stable trend with a slight peak in the middle. It remains in the middle range throughout.
* **Data Points:**
* x=0: y ≈ 12 (appears to start at the same point as `lcb`)
* x=1: y ≈ 15
* x=2: y ≈ 15
* x=3: y ≈ 16
* x=4: y ≈ 19
* x=5: y ≈ 15
* x=6: y ≈ 16
**3. Series: `humaneval` (Orange line, circle markers)**
* **Trend Verification:** This line is relatively flat and low for most of the range, with a sharp increase at the final data point.
* **Data Points:**
* x=0: y ≈ 6
* x=1: y ≈ 6
* x=2: y ≈ 7
* x=3: y ≈ 6
* x=4: y ≈ 7
* x=5: y ≈ 5
* x=6: y ≈ 16
**4. Series: `mbpp` (Red line, square markers)**
* **Trend Verification:** This line is low and volatile, showing no clear upward or downward trend. It has a notable dip at x=4.
* **Data Points:**
* x=0: y ≈ 6 (appears to start at the same point as `humaneval`)
* x=1: y ≈ 7
* x=2: y ≈ 4
* x=3: y ≈ 9
* x=4: y ≈ 3
* x=5: y ≈ 5
* x=6: y ≈ 4
### Key Observations
1. **Divergent Behavior of `lcb`:** The `lcb` benchmark exhibits a near-linear, strong positive correlation between the "Length" metric and the number of failed LLMs. This is the most prominent trend in the chart.
2. **Stability of `bcb`:** The `bcb` benchmark shows relative stability, with "Length" values fluctuating within a narrow band (15-19) regardless of task difficulty group.
3. **Low-Value Benchmarks:** Both `humaneval` and `mbpp` maintain low "Length" values (mostly below 10) for tasks where 0-5 LLMs failed. `humaneval` shows a significant jump at the most difficult task group (6 failed LLMs).
4. **Anomaly in `mbpp`:** The `mbpp` series has a distinct local minimum at x=4 (y≈3), which is the lowest recorded value on the entire chart.
5. **Convergence at Start:** At x=0 (tasks no LLMs failed), the `lcb` and `bcb` series start at approximately the same point (y≈12), as do the `humaneval` and `mbpp` series (y≈6).
### Interpretation
The chart likely analyzes the relationship between a benchmark's output characteristic (e.g., solution length, code length, response length) and the inherent difficulty of programming tasks. The "Length" metric is not standardized, so its absolute meaning is unclear, but the relative trends are informative.
* **What the data suggests:** The `lcb` benchmark's "Length" metric is highly sensitive to task difficulty. As tasks become harder (failing more LLMs), the `lcb` output grows substantially longer. This could imply that `lcb` measures or produces more verbose solutions for complex problems, or that its evaluation is tied to length.
* **Contrast with other benchmarks:** In stark contrast, `bcb`, `humaneval`, and `mbpp` do not show this strong scaling. Their "Length" metrics are largely independent of the number of failing LLMs, except for the final `humaneval` point. This suggests these benchmarks either measure a different property or their output length is not a primary factor in their scoring.
* **Relationship between elements:** The grouping variable ("Number of Failed LLMs") serves as a proxy for task difficulty. The chart reveals that different benchmarks respond to this difficulty gradient in fundamentally different ways. The `lcb` line's steep slope indicates a strong coupling between its metric and difficulty, while the flatness of the others indicates decoupling.
* **Notable implication:** If "Length" correlates with resource usage (e.g., token cost, generation time), then using the `lcb` benchmark for evaluation would become disproportionately more expensive for harder tasks compared to the others. The anomaly in `mbpp` at x=4 warrants investigation—it may represent a cluster of tasks that are difficult for LLMs but yield unusually concise solutions under the `mbpp` framework.