## Line Chart: Reasoning Accuracy vs. Problem Scale
### Overview
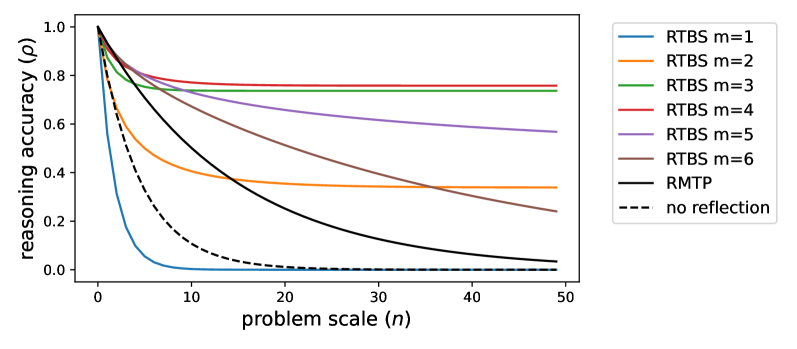
This image presents a line chart illustrating the relationship between reasoning accuracy (ρ) and problem scale (n) for different methods. The chart compares the performance of several "RTBS" methods (with varying 'm' values) against "RMTP" and a "no reflection" baseline.
### Components/Axes
* **X-axis:** "problem scale (n)", ranging from approximately 0 to 50.
* **Y-axis:** "reasoning accuracy (ρ)", ranging from 0 to 1.0.
* **Legend:** Located in the top-right corner, listing the following data series:
* RTBS m=1 (Blue)
* RTBS m=2 (Orange)
* RTBS m=3 (Green)
* RTBS m=4 (Red)
* RTBS m=5 (Purple)
* RTBS m=6 (Gray)
* RMTP (Black)
* no reflection (Black dashed)
### Detailed Analysis
The chart displays several downward-sloping curves, representing the decrease in reasoning accuracy as the problem scale increases.
* **RTBS m=1 (Blue):** This line starts at approximately 0.95 at n=0 and rapidly declines, reaching near 0 at n=10. It remains close to 0 for the rest of the scale.
* **RTBS m=2 (Orange):** Starts at approximately 0.95 at n=0, declines more gradually than m=1, reaching approximately 0.3 at n=20, and continues to decrease, reaching approximately 0.1 at n=50.
* **RTBS m=3 (Green):** Starts at approximately 0.95 at n=0, declines at a slower rate than m=2, reaching approximately 0.5 at n=20, and approximately 0.2 at n=50.
* **RTBS m=4 (Red):** Starts at approximately 0.95 at n=0, declines slowly, remaining above 0.6 until n=30, and reaching approximately 0.3 at n=50.
* **RTBS m=5 (Purple):** Starts at approximately 0.95 at n=0, declines very slowly, remaining above 0.7 until n=40, and reaching approximately 0.4 at n=50.
* **RTBS m=6 (Gray):** Starts at approximately 0.95 at n=0, declines the slowest of all RTBS methods, remaining above 0.8 until n=40, and reaching approximately 0.5 at n=50.
* **RMTP (Black):** Starts at approximately 0.95 at n=0, declines moderately, reaching approximately 0.4 at n=20, and approximately 0.2 at n=50.
* **no reflection (Black dashed):** Starts at approximately 0.95 at n=0, declines rapidly, reaching approximately 0.1 at n=10, and remaining close to 0 for the rest of the scale.
All lines begin at approximately 1.0 on the y-axis when n=0.
### Key Observations
* The "RTBS" methods with higher 'm' values (5 and 6) maintain higher reasoning accuracy for larger problem scales compared to those with lower 'm' values.
* The "no reflection" method exhibits the most rapid decline in reasoning accuracy as the problem scale increases.
* The "RMTP" method performs better than "no reflection" but worse than most of the "RTBS" methods, especially at larger problem scales.
* All methods show a decrease in reasoning accuracy as the problem scale increases.
### Interpretation
The chart demonstrates the impact of different methods on maintaining reasoning accuracy as the complexity of the problem (problem scale) increases. The "RTBS" methods, particularly those with higher 'm' values, appear to be more robust to increasing problem scale, suggesting they are better equipped to handle more complex reasoning tasks. The "no reflection" method's rapid decline indicates that reflection is crucial for maintaining accuracy in these types of problems. The "RMTP" method offers some improvement over not reflecting, but is not as effective as the RTBS methods. The 'm' parameter in the RTBS methods likely controls some aspect of the reflection process, with higher values leading to better performance at larger scales. This suggests a trade-off between the complexity of the method and its ability to scale to larger problems. The initial high accuracy across all methods suggests that all are effective for very simple problems.