## Line Chart: Differentiable Parameter Learning with 1 label
### Overview
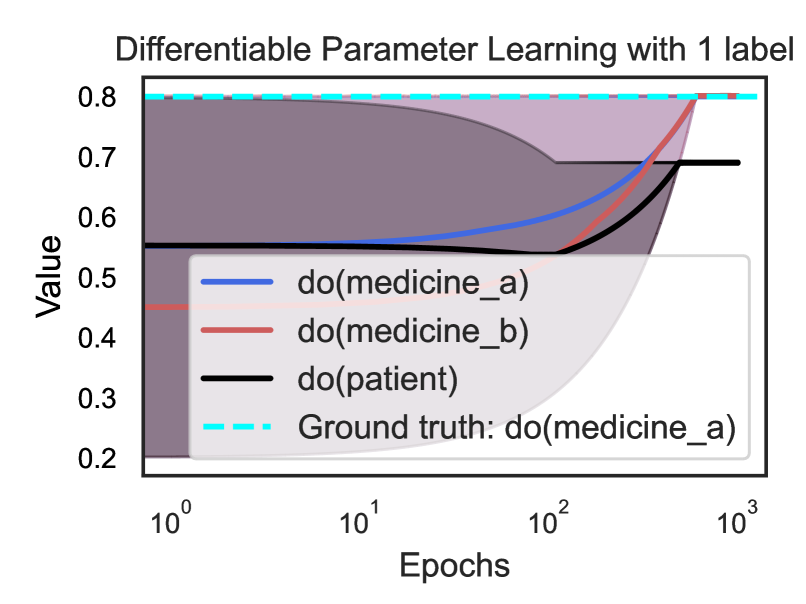
The image is a line chart titled "Differentiable Parameter Learning with 1 label". It displays the change in "Value" over "Epochs" for three different interventions: "do(medicine_a)", "do(medicine_b)", and "do(patient)", along with a "Ground truth: do(medicine_a)". The x-axis (Epochs) is on a logarithmic scale. Shaded regions around the lines indicate uncertainty.
### Components/Axes
* **Title:** Differentiable Parameter Learning with 1 label
* **X-axis:**
* Label: Epochs
* Scale: Logarithmic (base 10)
* Markers: 10<sup>0</sup>, 10<sup>1</sup>, 10<sup>2</sup>, 10<sup>3</sup>
* **Y-axis:**
* Label: Value
* Scale: Linear
* Markers: 0.2, 0.3, 0.4, 0.5, 0.6, 0.7, 0.8
* **Legend:** Located in the center of the chart.
* Blue line: do(medicine\_a)
* Red line: do(medicine\_b)
* Black line: do(patient)
* Cyan dashed line: Ground truth: do(medicine\_a)
### Detailed Analysis
* **do(medicine\_a) (Blue):** The blue line starts at a value of approximately 0.52 at 10<sup>0</sup> epochs. It increases gradually until approximately 10<sup>2</sup> epochs, then increases more rapidly, reaching a value of approximately 0.7 at 10<sup>3</sup> epochs.
* **do(medicine\_b) (Red):** The red line starts at a value of approximately 0.45 at 10<sup>0</sup> epochs. It remains relatively flat until approximately 10<sup>2</sup> epochs, then increases rapidly, reaching a value of approximately 0.78 at 10<sup>3</sup> epochs.
* **do(patient) (Black):** The black line starts at a value of approximately 0.55 at 10<sup>0</sup> epochs. It remains relatively flat until approximately 10<sup>2</sup> epochs, then increases slightly, reaching a value of approximately 0.69 at 10<sup>3</sup> epochs.
* **Ground truth: do(medicine\_a) (Cyan Dashed):** The cyan dashed line remains constant at a value of approximately 0.8 across all epochs.
### Key Observations
* The "Ground truth: do(medicine\_a)" serves as a benchmark, remaining constant throughout the epochs.
* "do(medicine\_a)" and "do(medicine\_b)" show significant increases in "Value" after 10<sup>2</sup> epochs.
* "do(patient)" shows a much smaller increase in "Value" compared to the medicine interventions.
* The shaded regions around the lines indicate the uncertainty in the estimated "Value" for each intervention. The uncertainty appears to decrease as the number of epochs increases, particularly for "do(medicine\_a)" and "do(medicine\_b)".
### Interpretation
The chart illustrates the learning process of a model attempting to predict the outcome of different interventions ("do(medicine\_a)", "do(medicine\_b)", "do(patient)") compared to a known "Ground truth" for "do(medicine\_a)". The x-axis represents the training progress (epochs), and the y-axis represents the model's performance ("Value").
The data suggests that the model learns to predict the effect of "do(medicine\_a)" and "do(medicine\_b)" more effectively as the number of epochs increases, as indicated by the increasing "Value" and decreasing uncertainty. The "do(patient)" intervention shows a less pronounced learning curve, suggesting that the model struggles to accurately predict its effect.
The convergence of "do(medicine\_a)" and "do(medicine\_b)" towards the "Ground truth" indicates that the model is successfully learning the underlying causal relationships. The slower convergence of "do(patient)" might indicate a more complex or less predictable relationship.