## Line Chart: Differentiable Parameter Learning with 1 label
### Overview
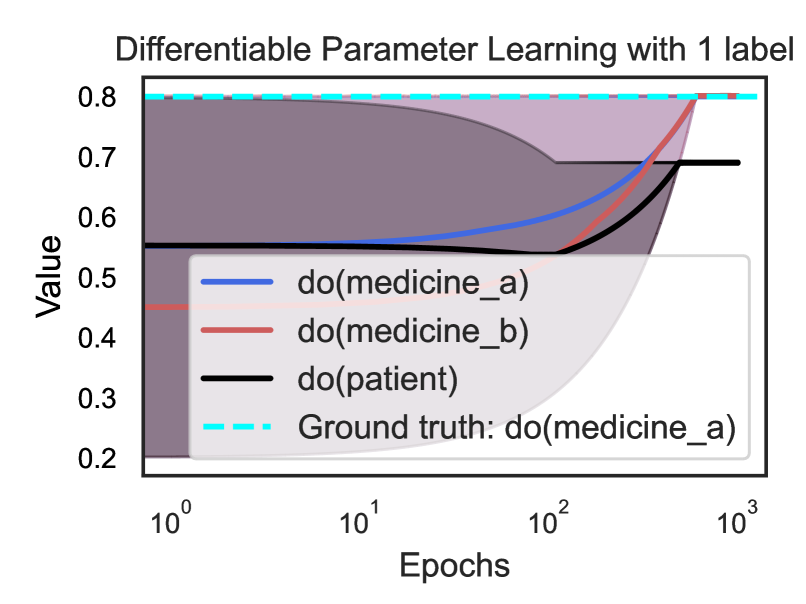
The image is a line chart illustrating the learning process of three parameters (labeled with `do()` notation, likely causal interventions) over training epochs, with a ground truth reference for one parameter. The x-axis uses a **logarithmic scale** for epochs, and the y-axis uses a **linear scale** for the parameter value.
### Components/Axes
- **Title**: *Differentiable Parameter Learning with 1 label*
- **X-axis**: *Epochs* (logarithmic scale: \(10^0, 10^1, 10^2, 10^3\))
- **Y-axis**: *Value* (linear scale: 0.2 to 0.8, with ticks at 0.2, 0.3, 0.4, 0.5, 0.6, 0.7, 0.8)
- **Legend** (bottom-right, approximate position):
- Blue line: `do(medicine_a)`
- Red line: `do(medicine_b)`
- Black line: `do(patient)`
- Cyan dashed line: *Ground truth: do(medicine_a)*
### Detailed Analysis
#### 1. Ground Truth (Cyan Dashed Line)
- **Trend**: Horizontal (constant) at \( y = 0.8 \) across all epochs (\(10^0\) to \(10^3\)).
- **Purpose**: Serves as the target value for `do(medicine_a)`.
#### 2. `do(medicine_a)` (Blue Line)
- **Trend**: Upward (increasing) with epochs, converging to the ground truth.
- **Data Points** (approximate):
- \(10^0\) epochs: \( y \approx 0.55 \)
- \(10^1\) epochs: \( y \approx 0.6 \)
- \(10^2\) epochs: \( y \approx 0.7 \)
- \(10^3\) epochs: \( y \approx 0.8 \) (converges to ground truth).
#### 3. `do(medicine_b)` (Red Line)
- **Trend**: Upward (increasing) with epochs, converging to the ground truth (slightly slower initial increase than `do(medicine_a)`).
- **Data Points** (approximate):
- \(10^0\) epochs: \( y \approx 0.45 \)
- \(10^1\) epochs: \( y \approx 0.5 \)
- \(10^2\) epochs: \( y \approx 0.6 \)
- \(10^3\) epochs: \( y \approx 0.8 \) (converges to ground truth).
#### 4. `do(patient)` (Black Line)
- **Trend**: Flat (constant) until ~\(10^2\) epochs, then upward (increasing) but less steep than `do(medicine_a)`/`do(medicine_b)`.
- **Data Points** (approximate):
- \(10^0\) to \(10^2\) epochs: \( y \approx 0.55 \) (constant).
- \(10^3\) epochs: \( y \approx 0.7 \) (does not reach the ground truth of 0.8).
#### 5. Shaded Area (Purple Region)
- **Purpose**: Likely represents a **confidence interval** or **variance** around the lines (e.g., for `do(medicine_a)` and `do(medicine_b)`), indicating uncertainty in the learning process.
### Key Observations
- `do(medicine_a)` and `do(medicine_b)` **converge to the ground truth** (0.8) as epochs increase, suggesting effective learning for these medical parameters.
- `do(patient)` has a **delayed, less steep increase** and does not reach the ground truth, indicating different learning dynamics (e.g., a different target or constraints).
- The **logarithmic x-axis** emphasizes early epochs (\(10^0\) to \(10^1\)) and shows convergence over a wide range of epochs (up to \(10^3\)).
### Interpretation
This chart visualizes the learning of causal parameters (via `do()` notation) in a differentiable parameter learning setup with one label. The ground truth for `do(medicine_a)` (0.8) acts as a reference, and both `do(medicine_a)` and `do(medicine_b)` learn to approach this value, demonstrating successful learning for medical interventions. The `do(patient)` parameter’s distinct trajectory suggests it targets a different outcome (e.g., patient-specific effects) or has unique constraints. The shaded area highlights variability in learning, critical for assessing the reliability of learned parameters. Overall, the chart illustrates how well the model learns causal relationships over training epochs, with the ground truth enabling accuracy evaluation.
(Note: All values are approximate, with uncertainty implied by the shaded region and visual estimation.)