## Line Graph: Differentiable Parameter Learning with 1 label
### Overview
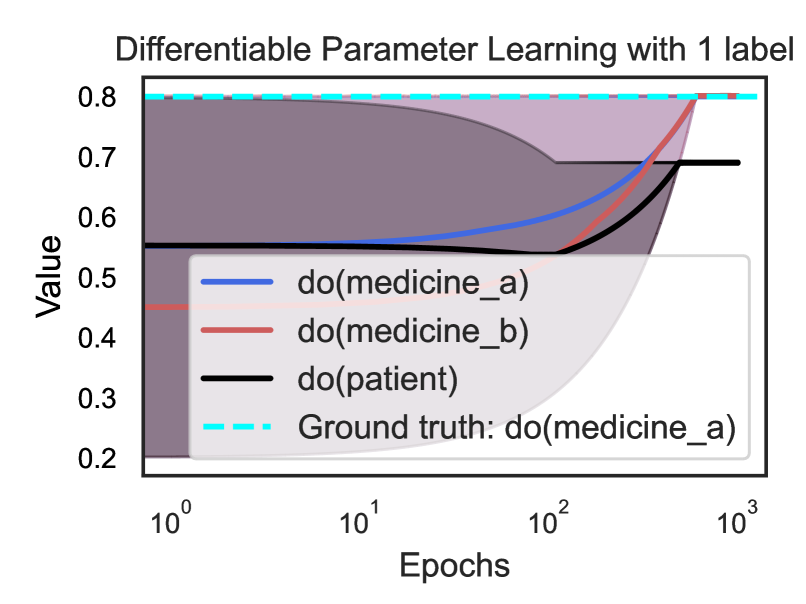
The graph illustrates the convergence of parameter values for three interventions (`do(medicine_a)`, `do(medicine_b)`, `do(patient)`) over logarithmic epochs (1 to 1000). A dashed cyan line represents the ground truth (`do(medicine_a)`). The y-axis (Value) ranges from 0.2 to 0.8, with shaded regions indicating uncertainty or confidence intervals.
### Components/Axes
- **X-axis (Epochs)**: Logarithmic scale from 10⁰ to 10³.
- **Y-axis (Value)**: Linear scale from 0.2 to 0.8.
- **Legend**: Located in the bottom-right corner, mapping colors to interventions:
- Blue: `do(medicine_a)`
- Red: `do(medicine_b)`
- Black: `do(patient)`
- Dashed Cyan: Ground truth (`do(medicine_a)`).
### Detailed Analysis
1. **`do(medicine_a)` (Blue Line)**:
- Starts at ~0.5 (epoch 10⁰) and increases steadily.
- Reaches ~0.8 by epoch 10³, closely aligning with the ground truth.
- Shaded gray region beneath the line suggests confidence intervals narrowing as epochs increase.
2. **`do(medicine_b)` (Red Line)**:
- Begins at ~0.4 (epoch 10⁰) and rises gradually.
- Crosses the black line (`do(patient)`) around epoch 10¹ but remains below the ground truth.
- Ends at ~0.75 (epoch 10³), still below the target.
3. **`do(patient)` (Black Line)**:
- Starts at ~0.6 (epoch 10⁰) but dips to ~0.5 by epoch 10¹.
- Recovers to ~0.7 by epoch 10³, showing volatility.
4. **Ground Truth (Dashed Cyan Line)**:
- Horizontal line at ~0.8, serving as the target value for `do(medicine_a)`.
### Key Observations
- **Convergence**: `do(medicine_a)` converges most effectively toward the ground truth, while `do(medicine_b)` and `do(patient)` show suboptimal performance.
- **Volatility**: `do(patient)` exhibits a sharp dip early in training, suggesting instability.
- **Uncertainty**: The shaded region under `do(medicine_a)` indicates decreasing uncertainty over time.
### Interpretation
The graph demonstrates that parameter learning for `do(medicine_a)` aligns closely with the ground truth, implying effective model calibration. In contrast, `do(medicine_b)` and `do(patient)` fail to match the target, highlighting potential issues in their learning dynamics. The early dip in `do(patient)` may reflect overfitting or insufficient regularization. The logarithmic epoch scale emphasizes early-stage learning dynamics, where `do(medicine_a)` shows rapid improvement compared to others. The shaded area for `do(medicine_a)` suggests confidence in its predictions, whereas the absence of shading for other lines implies higher uncertainty.