## Bar Chart: AI Model Performance Comparison
### Overview
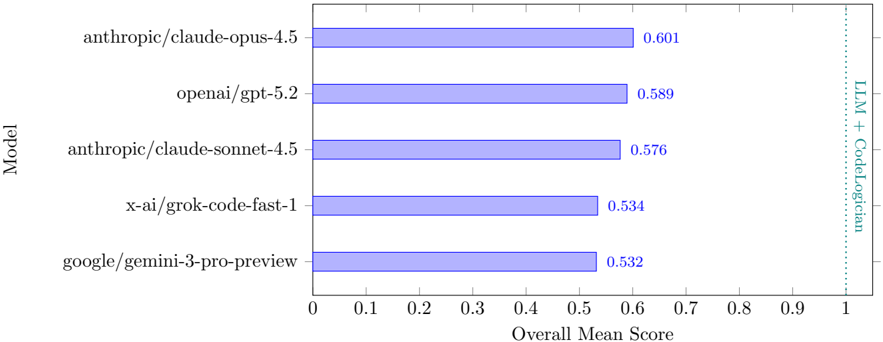
The chart compares the overall mean scores of five AI models against a benchmark labeled "LLM + CodeLogician" (dashed vertical line at ~0.9). Models are ranked by performance, with scores ranging from 0.532 to 0.601.
### Components/Axes
- **Y-Axis (Model)**: Lists AI models in descending order of performance:
1. anthropic/claude-opus-4.5
2. openai/gpt-5.2
3. anthropic/claude-sonnet-4.5
4. x-ai/grok-code-fast-1
5. google/gemini-3-pro-preview
- **X-Axis (Overall Mean Score)**: Scale from 0 to 1, with a vertical dashed line at 0.9 labeled "LLM + CodeLogician."
- **Legend**: Located on the right, associating teal color with "LLM + CodeLogician" and blue for model bars.
### Detailed Analysis
- **anthropic/claude-opus-4.5**: Score = 0.601 (highest, bar extends to ~0.6).
- **openai/gpt-5.2**: Score = 0.589 (second-highest, bar at ~0.59).
- **anthropic/claude-sonnet-4.5**: Score = 0.576 (third, bar at ~0.58).
- **x-ai/grok-code-fast-1**: Score = 0.534 (fourth, bar at ~0.53).
- **google/gemini-3-pro-preview**: Score = 0.532 (lowest, bar at ~0.53).
- **LLM + CodeLogician**: Dashed line at 0.9, far exceeding all model scores.
### Key Observations
1. **Performance Gap**: All models score below the "LLM + CodeLogician" benchmark (0.9), with the closest being claude-opus-4.5 (0.601).
2. **Model Hierarchy**: Anthropic models dominate, with claude-opus-4.5 outperforming claude-sonnet-4.5 by ~0.025.
3. **OpenAI vs. Others**: GPT-5.2 (0.589) outperforms x-ai and google models by ~0.055 and ~0.057, respectively.
4. **x-ai and Google**: Lowest performers, with scores nearly identical (0.534 vs. 0.532).
### Interpretation
The data suggests that while current AI models demonstrate varying levels of competence, none approach the hypothetical "LLM + CodeLogician" standard. Anthropic's claude-opus-4.5 leads the pack, but even its score (0.601) represents a 39.9% deficit from the benchmark. This gap highlights potential limitations in existing models' ability to integrate logical reasoning with language processing. The minimal difference between x-ai and google models (0.002) implies competitive parity in this specific evaluation metric. The chart underscores the need for advancements in AI architectures to bridge the performance gap with theoretical benchmarks.