## Scatter Plot: Accuracy vs. Time-to-Answer
### Overview
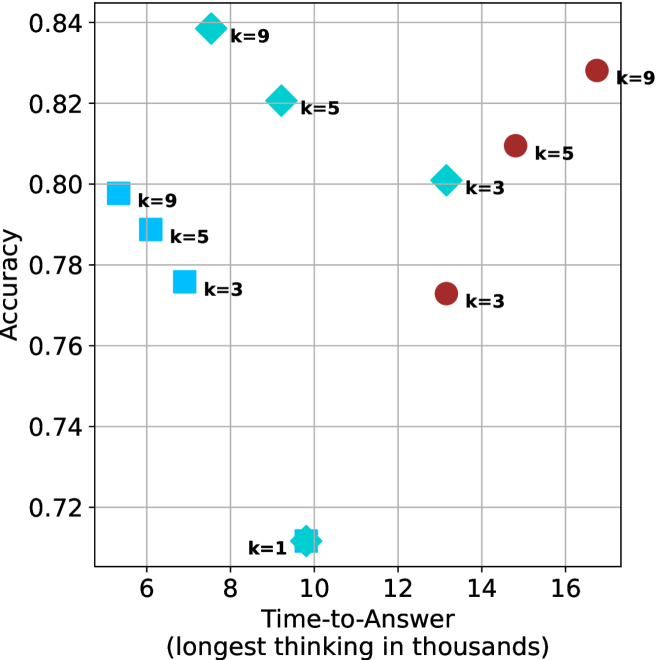
This image is a scatter plot visualizing the relationship between "Time-to-Answer" (x-axis) and "Accuracy" (y-axis). The data points are categorized into four distinct groups based on shape and color, with each point labeled with a "k" value (k=1, 3, 5, or 9). The chart suggests a performance benchmark, likely comparing different AI model configurations or inference strategies.
### Components/Axes
* **Y-Axis:** Labeled "Accuracy". The scale ranges from 0.72 to 0.84, with grid lines at 0.02 intervals.
* **X-Axis:** Labeled "Time-to-Answer (longest thinking in thousands)". The scale ranges from 6 to 16, with grid lines at 2-unit intervals.
* **Data Series (Categorized by Shape/Color):**
* **Cyan Squares:** Located on the left side of the chart.
* **Cyan Diamonds:** Located in the upper-middle section of the chart.
* **Cyan Star/Flower:** A single point located at the bottom-middle.
* **Maroon Circles:** Located on the right side of the chart.
* **Labels:** Each data point is annotated with a "k=" value, indicating a parameter setting for that specific data point.
### Detailed Analysis
The data points are grouped by shape/color. Below are the approximate coordinates (x, y) for each point:
**1. Cyan Squares (Left Cluster)**
* **k=9:** Positioned at approximately (5.3, 0.798).
* **k=5:** Positioned at approximately (6.3, 0.789).
* **k=3:** Positioned at approximately (7.3, 0.776).
* *Trend:* As the "k" value decreases from 9 to 3, the time-to-answer increases, and accuracy decreases.
**2. Cyan Diamonds (Upper-Middle Cluster)**
* **k=9:** Positioned at approximately (7.5, 0.839).
* **k=5:** Positioned at approximately (9.7, 0.821).
* **k=3:** Positioned at approximately (13.2, 0.801).
* *Trend:* As the "k" value decreases from 9 to 3, the time-to-answer increases significantly, and accuracy decreases.
**3. Cyan Star (Bottom Outlier)**
* **k=1:** Positioned at approximately (9.8, 0.712).
* *Trend:* This is an isolated point representing the lowest accuracy on the chart.
**4. Maroon Circles (Right Cluster)**
* **k=9:** Positioned at approximately (16.8, 0.828).
* **k=5:** Positioned at approximately (14.8, 0.810).
* **k=3:** Positioned at approximately (13.2, 0.773).
* *Trend:* Unlike the other groups, as the "k" value decreases from 9 to 3, both the time-to-answer and the accuracy decrease.
### Key Observations
* **Performance Efficiency:** The **Cyan Diamonds** group generally achieves the highest accuracy (peaking near 0.84) while maintaining moderate time-to-answer values.
* **The "k" Parameter:** The "k" parameter appears to influence accuracy positively in all groups (higher k = higher accuracy). However, the impact on time-to-answer varies by group.
* **Outlier:** The **k=1 (Cyan Star)** point is a significant outlier, showing the lowest accuracy (approx. 0.71) despite a moderate time-to-answer (approx. 9.8).
* **Group Separation:** The four groups are spatially distinct, suggesting they represent fundamentally different methods, models, or architectures, rather than just variations of the same process.
### Interpretation
This chart illustrates a classic "Pareto frontier" or trade-off analysis in computational performance.
* **Strategy Comparison:** The distinct clusters suggest four different approaches to solving a problem. The **Cyan Diamonds** appear to be the most efficient, providing the highest accuracy for the time invested.
* **Inversion of Logic:** The **Maroon Circles** exhibit a different behavior compared to the **Cyan Squares/Diamonds**. In the Maroon group, increasing "k" increases both time and accuracy, which is expected. However, in the Cyan groups, increasing "k" actually *decreases* the time-to-answer while increasing accuracy. This suggests that for the Cyan methods, higher "k" values might trigger a more efficient search or pruning mechanism, whereas for the Maroon method, higher "k" simply adds computational overhead.
* **Conclusion:** If the goal is to maximize accuracy, the **Cyan Diamond (k=9)** is the optimal choice. If the goal is to minimize time while maintaining acceptable accuracy, the **Cyan Square (k=9)** is the most efficient. The **Maroon Circles** are generally less efficient, as they require more time to achieve similar or lower accuracy than the Cyan Diamonds.