## Line Charts: NeurRL Performance vs. Parameters
### Overview
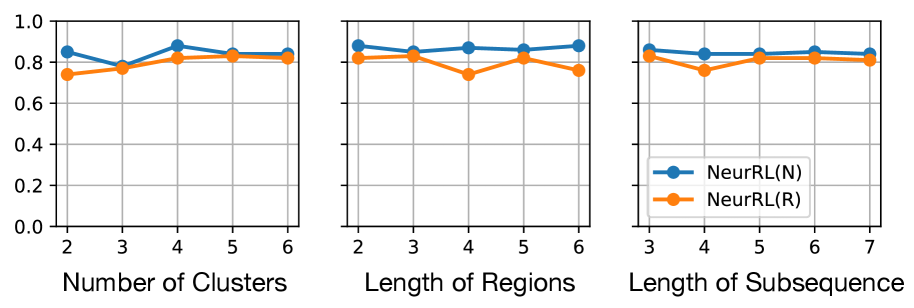
The image presents three line charts comparing the performance of two algorithms, NeurRL(N) and NeurRL(R), across different parameter settings. The charts depict performance (y-axis) against "Number of Clusters", "Length of Regions", and "Length of Subsequence" (x-axis).
### Components/Axes
* **Y-axis (all charts):** Performance, ranging from 0.0 to 1.0 in increments of 0.2.
* **X-axis (left chart):** Number of Clusters, with values 2, 3, 4, 5, and 6.
* **X-axis (middle chart):** Length of Regions, with values 2, 3, 4, 5, and 6.
* **X-axis (right chart):** Length of Subsequence, with values 3, 4, 5, 6, and 7.
* **Legend (bottom-right):**
* Blue line: NeurRL(N)
* Orange line: NeurRL(R)
### Detailed Analysis
**Chart 1: Number of Clusters**
* **NeurRL(N) (Blue):** The line starts at approximately 0.85 at 2 clusters, dips slightly to around 0.80 at 3 clusters, then rises to approximately 0.90 at 4 clusters, and decreases slightly to approximately 0.84 at 5 and 6 clusters.
* (2, 0.85)
* (3, 0.80)
* (4, 0.90)
* (5, 0.84)
* (6, 0.84)
* **NeurRL(R) (Orange):** The line starts at approximately 0.74 at 2 clusters, rises to approximately 0.78 at 3 clusters, then rises to approximately 0.83 at 4 clusters, and remains relatively stable at approximately 0.83 at 5 and 6 clusters.
* (2, 0.74)
* (3, 0.78)
* (4, 0.83)
* (5, 0.83)
* (6, 0.83)
**Chart 2: Length of Regions**
* **NeurRL(N) (Blue):** The line starts at approximately 0.89 at length 2, dips slightly to around 0.87 at length 3, then rises to approximately 0.88 at length 4, and increases slightly to approximately 0.90 at lengths 5 and 6.
* (2, 0.89)
* (3, 0.87)
* (4, 0.88)
* (5, 0.90)
* (6, 0.90)
* **NeurRL(R) (Orange):** The line starts at approximately 0.83 at length 2, dips to approximately 0.74 at length 3, then rises to approximately 0.82 at length 4, and remains relatively stable at approximately 0.84 at lengths 5 and 6.
* (2, 0.83)
* (3, 0.74)
* (4, 0.82)
* (5, 0.84)
* (6, 0.84)
**Chart 3: Length of Subsequence**
* **NeurRL(N) (Blue):** The line starts at approximately 0.88 at length 3, dips slightly to around 0.84 at length 4, then rises to approximately 0.87 at length 5, and increases slightly to approximately 0.90 at lengths 6 and 7.
* (3, 0.88)
* (4, 0.84)
* (5, 0.87)
* (6, 0.90)
* (7, 0.90)
* **NeurRL(R) (Orange):** The line starts at approximately 0.80 at length 3, rises to approximately 0.82 at length 4, then remains relatively stable at approximately 0.82 at lengths 5, 6 and 7.
* (3, 0.80)
* (4, 0.82)
* (5, 0.82)
* (6, 0.82)
* (7, 0.82)
### Key Observations
* NeurRL(N) generally outperforms NeurRL(R) across all parameter settings.
* The performance of both algorithms is relatively stable across the tested parameter ranges.
* NeurRL(R) shows a more pronounced dip in performance at lower values of "Length of Regions" (length 3).
### Interpretation
The charts suggest that NeurRL(N) is a more robust algorithm than NeurRL(R) across the tested parameter ranges. While both algorithms exhibit relatively stable performance, NeurRL(N) consistently achieves higher performance scores. The dip in NeurRL(R)'s performance at a "Length of Regions" of 3 indicates that this parameter may be more sensitive for that algorithm. The data implies that NeurRL(N) is less sensitive to the specific parameter settings within the tested ranges, making it a potentially more reliable choice. Further investigation could explore the performance of these algorithms outside of these parameter ranges to identify optimal settings and potential limitations.