\n
## [Line Charts]: Performance Comparison of NeurRL(N) and NeurRL(R) Across Three Parameters
### Overview
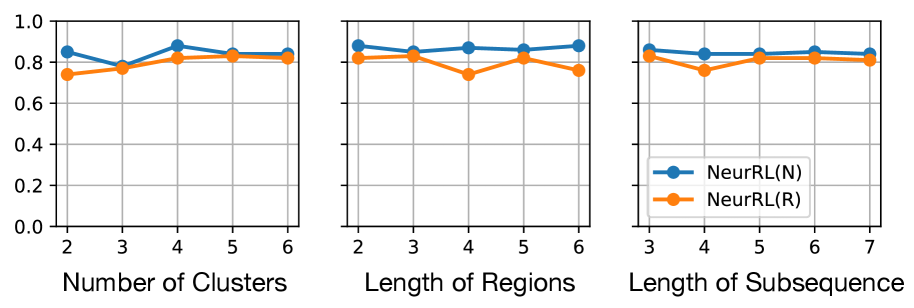
The image displays three horizontally arranged line charts comparing the performance of two methods, labeled "NeurRL(N)" and "NeurRL(R)". The charts share a common y-axis scale (0.0 to 1.0) but have different x-axes representing distinct parameters: "Number of Clusters", "Length of Regions", and "Length of Subsequence". A single legend is provided in the third chart.
### Components/Axes
* **Y-Axis (All Charts):** Unlabeled, but scale ranges from 0.0 to 1.0 with major tick marks at 0.0, 0.2, 0.4, 0.6, 0.8, and 1.0. This likely represents a performance metric (e.g., accuracy, score).
* **X-Axis (Left Chart):** "Number of Clusters". Ticks at integer values: 2, 3, 4, 5, 6.
* **X-Axis (Middle Chart):** "Length of Regions". Ticks at integer values: 2, 3, 4, 5, 6.
* **X-Axis (Right Chart):** "Length of Subsequence". Ticks at integer values: 3, 4, 5, 6, 7.
* **Legend (Bottom-Right of Right Chart):**
* Blue line with circle markers: `NeurRL(N)`
* Orange line with circle markers: `NeurRL(R)`
### Detailed Analysis
**Chart 1: Number of Clusters**
* **NeurRL(N) (Blue):** Starts at ~0.85 (x=2), dips to ~0.78 (x=3), peaks at ~0.88 (x=4), then stabilizes around ~0.84 (x=5,6). Trend: Initial dip, peak at 4 clusters, then plateau.
* **NeurRL(R) (Orange):** Starts lower at ~0.74 (x=2), rises to ~0.78 (x=3), peaks at ~0.82 (x=4), and plateaus around ~0.82 (x=5,6). Trend: Steady increase to a plateau.
* **Comparison:** NeurRL(N) consistently scores higher than NeurRL(R) across all cluster numbers. The gap is narrowest at x=3 and widest at x=4.
**Chart 2: Length of Regions**
* **NeurRL(N) (Blue):** Starts high at ~0.88 (x=2), dips slightly to ~0.84 (x=3), rises to ~0.87 (x=4), dips to ~0.85 (x=5), and ends at ~0.87 (x=6). Trend: Relatively stable with minor fluctuations.
* **NeurRL(R) (Orange):** Starts at ~0.82 (x=2), rises to ~0.84 (x=3), dips sharply to ~0.74 (x=4), recovers to ~0.82 (x=5), and dips again to ~0.76 (x=6). Trend: Volatile, with a significant dip at region length 4.
* **Comparison:** NeurRL(N) maintains a clear and consistent performance advantage. The most notable feature is the large performance drop for NeurRL(R) at a region length of 4.
**Chart 3: Length of Subsequence**
* **NeurRL(N) (Blue):** Starts at ~0.85 (x=3), dips slightly to ~0.83 (x=4), rises to ~0.84 (x=5), peaks at ~0.85 (x=6), and ends at ~0.84 (x=7). Trend: Very stable, hovering around 0.84-0.85.
* **NeurRL(R) (Orange):** Starts at ~0.82 (x=3), dips to ~0.76 (x=4), recovers to ~0.82 (x=5), and plateaus around ~0.81 (x=6,7). Trend: A distinct dip at subsequence length 4, followed by recovery and plateau.
* **Comparison:** NeurRL(N) is again superior and more stable. Both methods show a performance dip at subsequence length 4, but the dip is much more severe for NeurRL(R).
### Key Observations
1. **Consistent Superiority:** The `NeurRL(N)` method (blue line) achieves a higher score than `NeurRL(R)` (orange line) at every data point across all three charts.
2. **Stability vs. Volatility:** `NeurRL(N)` exhibits relatively stable performance with minor fluctuations. `NeurRL(R)` is more volatile, showing significant performance drops at specific parameter values (Region Length=4, Subsequence Length=4).
3. **Critical Parameter Value:** The value "4" on the x-axis appears to be a critical point. In the middle and right charts, `NeurRL(R)` experiences its most significant performance degradation at this point.
4. **Plateauing Effect:** In the first chart (Number of Clusters), both methods show a plateau in performance after 4 clusters, suggesting diminishing returns or a performance ceiling for this parameter.
### Interpretation
The data suggests that the `NeurRL(N)` method is both more effective (higher scores) and more robust (less sensitive to parameter changes) than `NeurRL(R)` for the task being measured. The consistent gap indicates a fundamental advantage in the `N` variant's design.
The pronounced dips for `NeurRL(R)` at a value of 4 for both "Length of Regions" and "Length of Subsequence" are highly significant. This could indicate a specific weakness in the `R` method's algorithm when handling medium-length sequential or regional patterns. It might struggle with a particular scale of complexity that emerges at that length, whereas the `N` method handles it without issue.
The plateau in the first chart implies that increasing the "Number of Clusters" beyond 4 does not meaningfully improve performance for either method. This is a practical insight for resource allocation, suggesting that using more than 4 clusters may be computationally wasteful for minimal gain.
Overall, this technical comparison strongly favors the adoption of `NeurRL(N)` over `NeurRL(R)`, particularly in scenarios where the "Length of Regions" or "Length of Subsequence" parameters might be set to or near the value of 4.