## Line Graph: LM Loss vs. PFlOP/s-days for MoBA and Full Attention Projections
### Overview
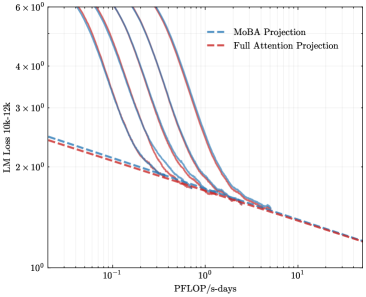
The image is a logarithmic line graph comparing two computational efficiency projections: **MoBA Projection** (blue dashed line) and **Full Attention Projection** (red dashed line). The x-axis represents **PFlOP/s-days** (petaFLOPS per second-days), and the y-axis represents **LM Loss 10k-12k** (likely a metric for language model performance or error rate). Both axes use logarithmic scales, with the x-axis ranging from 10⁻¹ to 10¹ and the y-axis from 10⁰ to 6×10⁰.
---
### Components/Axes
- **X-axis (PFlOP/s-days)**: Logarithmic scale from 10⁻¹ to 10¹.
- **Y-axis (LM Loss 10k-12k)**: Logarithmic scale from 10⁰ to 6×10⁰.
- **Legend**:
- **Blue dashed line**: MoBA Projection.
- **Red dashed line**: Full Attention Projection.
- **Placement**:
- Legend is in the **top-right corner**.
- Axes labels are positioned at the **bottom** (x-axis) and **left** (y-axis).
---
### Detailed Analysis
1. **MoBA Projection (Blue Dashed Line)**:
- Starts at approximately **5×10⁰** on the y-axis when PFlOP/s-days is 10⁻¹.
- Decreases sharply, crossing the **Full Attention Projection** line near **10⁰** on the x-axis (PFlOP/s-days = 1).
- Continues to decline, reaching ~1.5×10⁰ at 10¹ PFlOP/s-days.
2. **Full Attention Projection (Red Dashed Line)**:
- Starts at ~3×10⁰ on the y-axis at 10⁻¹ PFlOP/s-days.
- Decreases more gradually, remaining above the MoBA Projection until ~10⁰ on the x-axis.
- Converges with the MoBA Projection near 10¹ PFlOP/s-days, both approaching ~1×10⁰.
3. **Key Intersection**:
- The two lines **cross** at approximately **10⁰ PFlOP/s-days** (x-axis = 1), with a y-axis value of ~2×10⁰.
- Beyond this point, the MoBA Projection outperforms the Full Attention Projection in terms of lower LM Loss.
---
### Key Observations
- **Initial Performance**:
- At low computational costs (10⁻¹ PFlOP/s-days), the Full Attention Projection has a lower LM Loss (~3×10⁰) compared to MoBA (~5×10⁰).
- **Efficiency Trade-off**:
- MoBA Projection achieves better performance (lower loss) at higher computational costs (10¹ PFlOP/s-days).
- **Convergence**:
- Both projections converge near 10¹ PFlOP/s-days, suggesting diminishing returns for both approaches at extreme computational scales.
---
### Interpretation
- **MoBA Projection** demonstrates superior scalability, as its loss decreases more rapidly with increased computational resources. This suggests it may be more efficient for high-performance scenarios.
- The **crossing point** at 10⁰ PFlOP/s-days indicates a critical threshold where MoBA becomes more effective than Full Attention.
- The **convergence** at 10¹ PFlOP/s-days implies that both methods plateau in performance gains beyond this computational cost, highlighting potential limitations in further optimization.
- The logarithmic scales emphasize exponential relationships, underscoring the importance of computational efficiency in large-scale language model training.
---
**Note**: Exact numerical values are approximated due to the absence of gridlines or data points. Uncertainty arises from the logarithmic scaling and visual estimation of line positions.