\n
## Network Diagrams: Causal Inference Models
### Overview
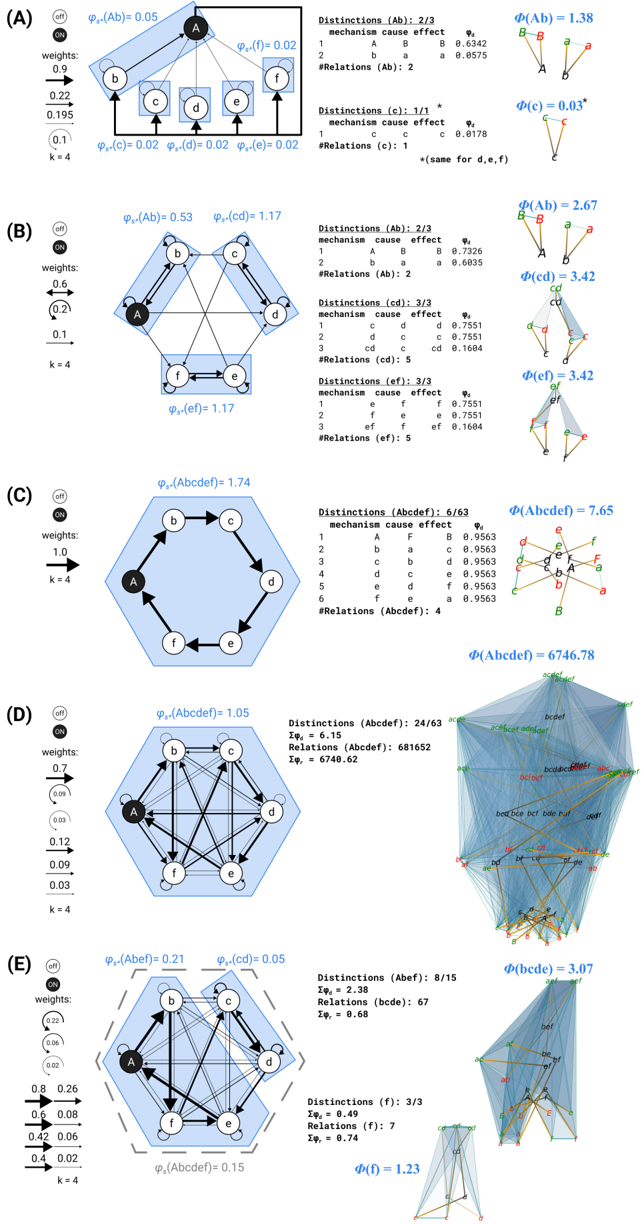
The image presents five distinct network diagrams (labeled A through E) illustrating causal relationships between variables. Each diagram depicts a network of nodes (labeled a, b, c, d, e, f) connected by directed edges, representing causal influences. Accompanying each diagram are quantitative measures related to the network structure, including probabilities (Φ), distinctions, and weights. The diagrams appear to be exploring the relationship between network structure and causal strength.
### Components/Axes
Each diagram shares the following components:
* **Nodes:** Represent variables (a, b, c, d, e, f).
* **Directed Edges:** Indicate causal relationships (e.g., A -> B means A causes B).
* **Probabilities (Φ):** Represent the strength of causal relationships between pairs of nodes. Labeled as Φ<sub>(XY)</sub>.
* **Distinctions:** A table quantifying the number of mechanisms and effects for different variable combinations.
* **Weights:** A scale indicating the relative importance of the network structure.
* **Φ(XY):** A numerical value representing the causal effect of X on Y.
Diagram E includes a data table with two columns: "bin" and "count".
### Detailed Analysis or Content Details
**Diagram A:**
* Φ<sub>(Ab)</sub> = 0.05
* Φ<sub>(c)</sub> = 0.02
* Φ<sub>(d)</sub> = 0.02
* Φ<sub>(e)</sub> = 0.02
* Distinctions (Ab): 2/2. Mechanism: cause/effect. Values: 0.6342, 0.9575. #Relations (Ab): 2
* Distinctions (c): 1/1. Mechanism: cause/effect. Value: 0.8178. #Relations (c): 1
* Φ(Ab) = 1.38
* Φ(c) = 0.03
**Diagram B:**
* Φ<sub>(Ab)</sub> = 0.53
* Φ<sub>(cd)</sub> = 1.17
* Φ<sub>(ef)</sub> = 1.17
* Distinctions (Ab): 2/2. Mechanism: cause/effect. Values: 0.7526, 0.6635. #Relations (Ab): 2
* Distinctions (cd): 3/3. Mechanism: cause/effect. Values: 0.7551, 0.7551, 0.1604. #Relations (cd): 3
* Φ(Ab) = 2.67
* Φ(cd) = 3.42
* Φ(ef) = 3.42
**Diagram C:**
* Φ<sub>(Abcdef)</sub> = 1.74
* Distinctions (Abcdef): 6/63. Mechanism: cause/effect. Values: 0.9563, 0.9563, 0.9563, 0.9563, 0.9563, 0.9563. #Relations (Abcdef): 4
* Φ(Abcdef) = 7.65
* Φ(Abcdef) = 6746.78
**Diagram D:**
* Φ<sub>(Abcdef)</sub> = 1.09
* Φ<sub>(Abcdef)</sub> = 6463.6
* Distinctions (Abcdef): 4/4. Mechanism: cause/effect. Values: 0.9563, 0.9563, 0.9563, 0.9563. #Relations (Abcdef): 4
* Φ(Abcdef) = 6746.78
* A small text box reads: "bootstrap bias beta=0.001"
**Diagram E:**
* Φ<sub>(Abcdef)</sub> = 2.21
* Distinctions (Abcdef): 7/7. Mechanism: cause/effect. Values: 0.9563, 0.9563, 0.9563, 0.9563, 0.9563, 0.9563, 0.9563. #Relations (Abcdef): 7
* Φ(Abcdef) = 13.14
* Data Table:
| bin | count |
| :---- | :---- |
| 0.00 | 9 |
| 0.02 | 7 |
| 0.04 | 8 |
| 0.06 | 10 |
| 0.08 | 12 |
| 0.10 | 14 |
### Key Observations
* As the network complexity increases (from A to E), the values of Φ<sub>(Abcdef)</sub> and the corresponding Φ values generally increase.
* The "Distinctions" tables consistently show a "cause/effect" mechanism with values close to 1.0.
* Diagram D includes a note about "bootstrap bias," suggesting a statistical consideration in the analysis.
* Diagram E presents a histogram-like distribution of counts across different bins.
### Interpretation
These diagrams appear to be exploring the relationship between network structure and the strength of causal inference. The increasing values of Φ and the associated metrics as the network grows suggest that more complex networks can support stronger causal conclusions. The "Distinctions" tables provide a quantitative breakdown of the causal mechanisms within each network. The bootstrap bias note in Diagram D indicates that the results may be sensitive to the sampling method used. Diagram E's data table likely represents the distribution of causal effect estimates obtained through a bootstrapping procedure, providing insight into the uncertainty associated with the causal inference. The consistent values in the "Distinctions" tables suggest a robust causal mechanism at play, while the increasing Φ values indicate a strengthening of the overall causal effect with network complexity. The diagrams collectively demonstrate a systematic investigation into the interplay between network structure, causal strength, and statistical considerations in causal inference.