\n
## Line Chart: Induction Success vs. Parameters
### Overview
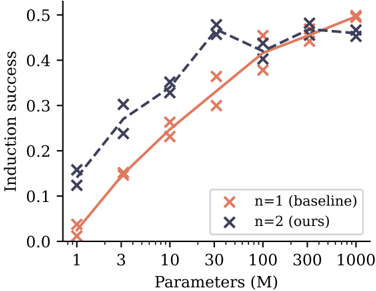
This image presents a line chart illustrating the relationship between the number of parameters (in millions) and induction success. Two data series are plotted, representing different values of 'n' (n=1 and n=2). The chart demonstrates how induction success changes as the number of parameters increases for both scenarios.
### Components/Axes
* **X-axis:** "Parameters (M)" - Scale ranges from approximately 1 to 1000, with markers at 1, 3, 10, 30, 100, 300, and 1000.
* **Y-axis:** "Induction success" - Scale ranges from 0.0 to 0.5, with markers at 0.0, 0.1, 0.2, 0.3, 0.4, and 0.5.
* **Legend:** Located in the top-right corner.
* "n = 1 (baseline)" - Represented by an orange 'x' marker.
* "n = 2 (ours)" - Represented by a dark blue 'x' marker.
### Detailed Analysis
**Data Series 1: n = 1 (baseline) - Orange Line**
The orange line representing n=1 exhibits an upward trend initially, then plateaus.
* At 1 M parameters, induction success is approximately 0.05.
* At 3 M parameters, induction success is approximately 0.15.
* At 10 M parameters, induction success is approximately 0.30.
* At 30 M parameters, induction success is approximately 0.38.
* At 100 M parameters, induction success is approximately 0.42.
* At 300 M parameters, induction success is approximately 0.45.
* At 1000 M parameters, induction success is approximately 0.46.
**Data Series 2: n = 2 (ours) - Dark Blue Line**
The dark blue line representing n=2 shows a steeper upward trend than the orange line, reaching a peak and then slightly decreasing.
* At 1 M parameters, induction success is approximately 0.13.
* At 3 M parameters, induction success is approximately 0.25.
* At 10 M parameters, induction success is approximately 0.37.
* At 30 M parameters, induction success is approximately 0.44.
* At 100 M parameters, induction success is approximately 0.47.
* At 300 M parameters, induction success is approximately 0.48.
* At 1000 M parameters, induction success is approximately 0.47.
### Key Observations
* The "n=2" data series consistently outperforms the "n=1" data series across all parameter values.
* Both data series demonstrate diminishing returns as the number of parameters increases beyond 300 M. The improvement in induction success becomes marginal.
* The "n=2" series reaches its peak performance around 300 M parameters, then slightly declines at 1000 M.
### Interpretation
The chart suggests that increasing the number of parameters generally improves induction success, but the benefit diminishes with larger parameter counts. The "n=2" configuration ("ours") consistently achieves higher induction success than the "n=1" baseline, indicating that the proposed method (represented by n=2) is more effective. The slight decline in performance for the "n=2" series at 1000 M parameters could indicate overfitting or the point of diminishing returns for this specific model configuration. The data implies that there is an optimal parameter range for maximizing induction success, and exceeding that range may not yield significant improvements and could even lead to a slight decrease in performance. The chart provides evidence supporting the effectiveness of the "ours" method (n=2) over the baseline (n=1) in achieving higher induction success, particularly within the range of 1 to 300 million parameters.