\n
## Diagram: Evolution of Step-by-step Construction heuristics for TSP
### Overview
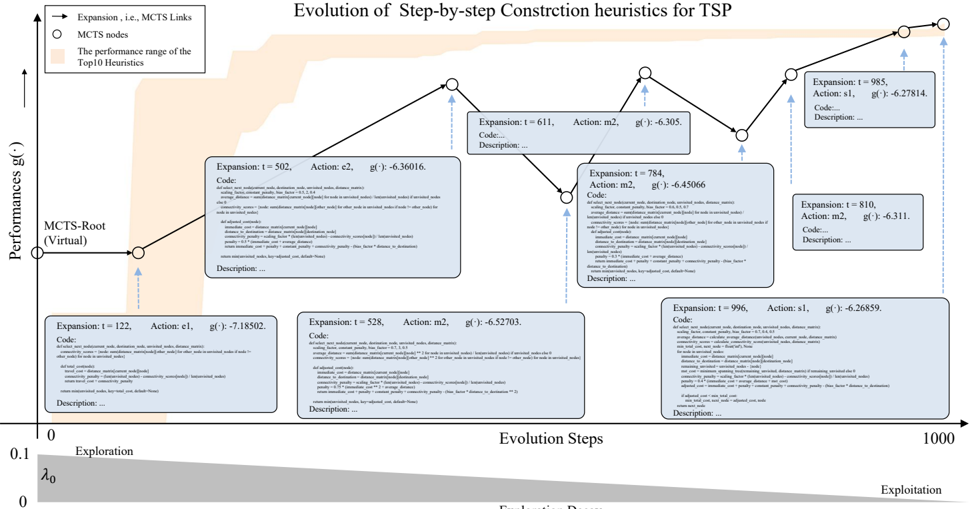
This diagram illustrates the evolution of step-by-step construction heuristics for the Traveling Salesperson Problem (TSP). It depicts a landscape of performance (g(·)) over evolution steps, with expansions represented as nodes connected by arrows. The diagram visualizes the search process of Monte Carlo Tree Search (MCTS) and highlights the performance of the top 10 heuristics.
### Components/Axes
* **Title:** Evolution of Step-by-step Construction heuristics for TSP
* **Y-axis:** Performance g(·) - Ranges approximately from -8 to -6.2.
* **X-axis:** Evolution Steps - Ranges from 0 to 1000. Labeled with "Exploration" on the left side (0-ish) and "Exploitation" on the right side (1000-ish).
* **Legend:**
* Arrow: Expansion, i.e., MCTS Links
* Circle: MCTS nodes
* Text: The performance range of the Top10 Heuristics
* **Key Elements:**
* MCTS-Root (Virtual) - Located at approximately (0, 0.1)
* Expansion Nodes - Rectangular boxes at various points along the evolution steps, each containing information about the expansion.
* Arrows - Connecting expansion nodes, indicating the MCTS search process.
* Orange Shaded Area - Represents the performance landscape.
### Detailed Analysis / Content Details
The diagram shows several expansion nodes with associated data. Here's a breakdown of each visible node:
1. **Expansion: t = 122**
* Action: e1
* g(·): -7.18502
* Code: (Text block - see below)
* Description: (Text block - see below)
2. **Expansion: t = 502**
* Action: e2
* g(·): -6.36016
* Code: (Text block - see below)
* Description: (Text block - see below)
3. **Expansion: t = 528**
* Action: m2
* g(·): -6.52703
* Code: (Text block - see below)
* Description: (Text block - see below)
4. **Expansion: t = 611**
* Action: m2
* g(·): -6.305
* Code: (Text block - see below)
* Description: (Text block - see below)
5. **Expansion: t = 784**
* Action: m2
* g(·): -6.45066
* Code: (Text block - see below)
* Description: (Text block - see below)
6. **Expansion: t = 810**
* Action: m2
* g(·): -6.311
* Code: (Text block - see below)
* Description: (Text block - see below)
7. **Expansion: t = 965**
* Action: s1
* g(·): -6.27814
* Code: (Text block - see below)
* Description: (Text block - see below)
8. **Expansion: t = 996**
* Action: s1
* g(·): -6.26859
* Code: (Text block - see below)
* Description: (Text block - see below)
**Text Block Content (repeated in each expansion node):**
```
1. random_restart_neighbor_search
2. random_restart_neighbor_search_2
3. random_restart_neighbor_search_3
4. random_restart_neighbor_search_4
5. random_restart_neighbor_search_5
6. random_restart_neighbor_search_6
7. random_restart_neighbor_search_7
8. random_restart_neighbor_search_8
9. random_restart_neighbor_search_9
10. random_restart_neighbor_search_10
```
The text block is identical in each expansion node. It lists ten different search algorithms.
### Key Observations
* The performance (g(·)) generally improves (becomes less negative) as the evolution steps increase, indicating a convergence towards better solutions.
* The initial expansions (t=122, t=502) have significantly worse performance than later expansions.
* The actions taken during expansion vary (e1, m2, s1), suggesting different heuristic strategies are being explored.
* The orange shaded area represents a complex performance landscape, with potential local optima.
* The MCTS search appears to be exploring different branches of the search space, as indicated by the arrows connecting the expansion nodes.
### Interpretation
This diagram illustrates the application of MCTS to optimize step-by-step construction heuristics for the TSP. The evolution steps represent the iterations of the MCTS algorithm, where each expansion node corresponds to a new heuristic being evaluated. The performance metric g(·) quantifies the quality of the solution found by each heuristic.
The diagram suggests that the MCTS algorithm is effectively exploring the search space and identifying better heuristics over time. The initial exploration phase (left side of the diagram) is characterized by high variance in performance, while the exploitation phase (right side) shows a more consistent improvement.
The repeated text block within each expansion node indicates that the algorithm is evaluating different variations of the "random\_restart\_neighbor\_search" algorithm. The varying actions (e1, m2, s1) likely represent different parameters or configurations of these algorithms.
The orange shaded area represents the complexity of the TSP problem and the challenges of finding optimal solutions. The diagram highlights the importance of exploration and exploitation in the search process, as well as the ability of MCTS to adaptively balance these two objectives. The diagram does not provide any quantitative data on the number of iterations or the specific parameters used in the MCTS algorithm.