# Technical Document Extraction: Machine Learning Model Comparison
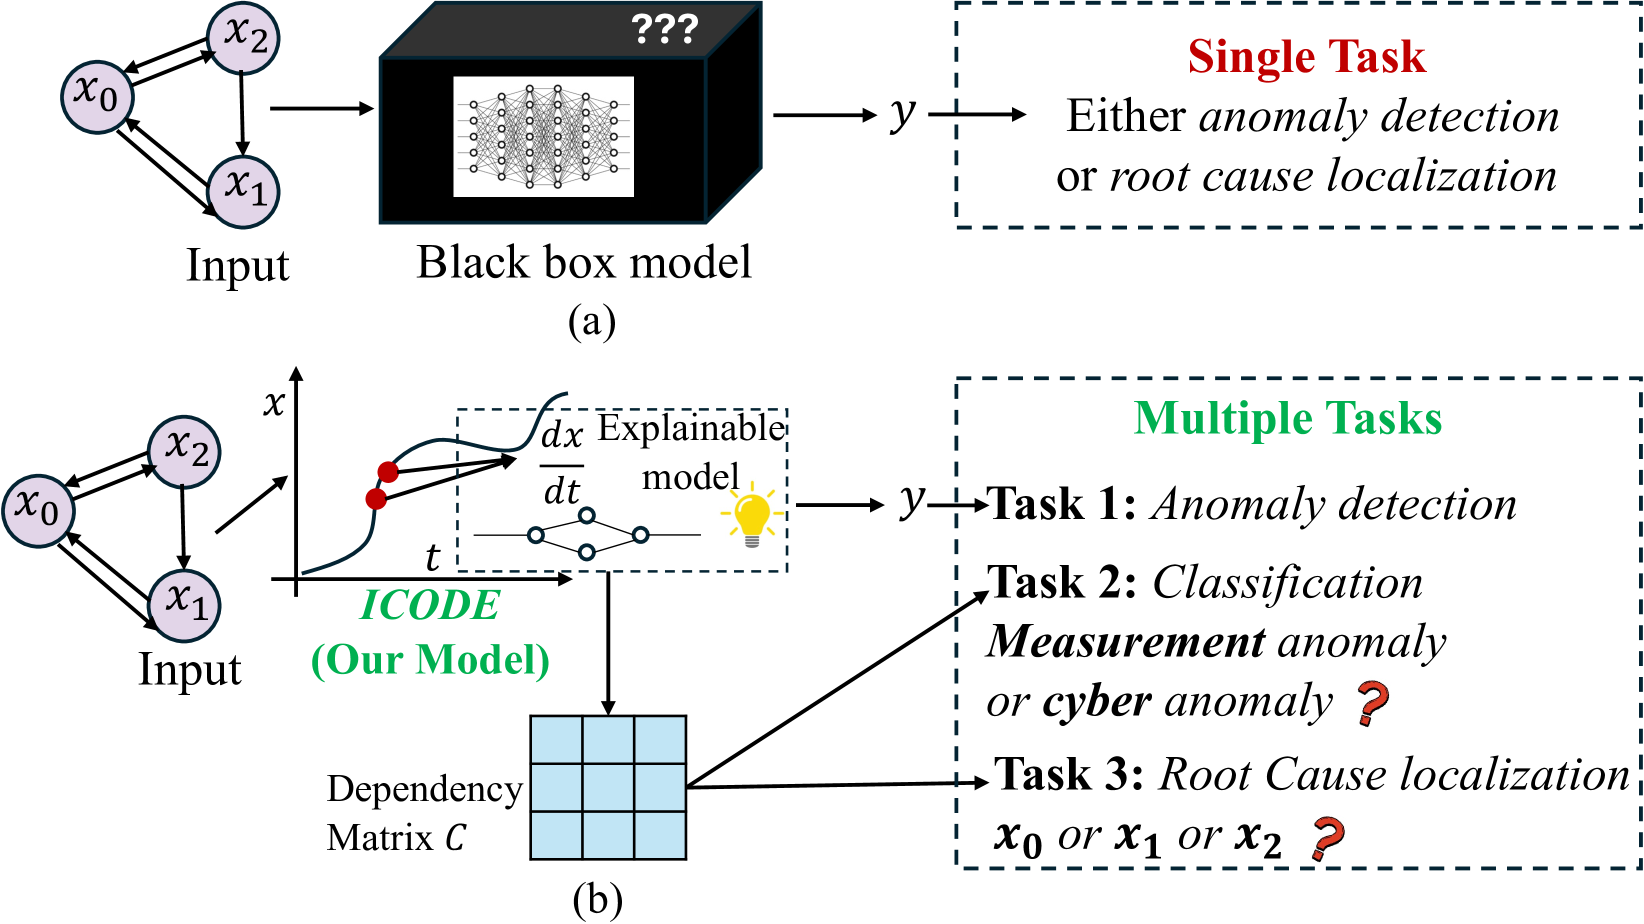
This image contains two comparative diagrams, labeled **(a)** and **(b)**, illustrating the difference between a traditional "Black box" machine learning approach and a proposed explainable model named **ICODE**.
---
## Section (a): Traditional Black Box Model
This section describes a linear pipeline for a single-task machine learning process.
### 1. Input Component
* **Visual Representation:** A directed graph consisting of three nodes: $x_0$, $x_1$, and $x_2$.
* **Connectivity:**
* Bidirectional arrows between $x_0$ and $x_2$.
* Bidirectional arrows between $x_0$ and $x_1$.
* A unidirectional arrow from $x_2$ to $x_1$.
* **Label:** "Input"
### 2. Processing Component
* **Visual Representation:** A 3D black box labeled with three question marks (**???**). Inside the box, a white inset shows a dense neural network diagram (multiple layers of interconnected nodes).
* **Label:** "Black box model"
### 3. Output Component
* **Flow:** An arrow points from the Black box to a variable $y$.
* **Container:** A dashed rectangular box.
* **Header Text:** **Single Task** (in red font).
* **Description Text:** "Either *anomaly detection* or *root cause localization*"
* **Logic:** The model is limited to performing one specific task at a time.
---
## Section (b): ICODE (Proposed Explainable Model)
This section describes a multi-faceted pipeline capable of performing multiple tasks simultaneously through an explainable framework.
### 1. Input Component
* **Visual Representation:** Identical to section (a); a directed graph with nodes $x_0$, $x_1$, and $x_2$.
* **Label:** "Input"
### 2. Processing Component (ICODE)
* **Label:** ***ICODE*** **(Our Model)** (in green font).
* **Sub-components:**
* **Coordinate Plot:** A graph with axes $x$ (vertical) and $t$ (horizontal). It shows a blue curve with two red data points. Arrows from these points lead into the next sub-component.
* **Explainable Model Box:** A dashed box containing:
* The mathematical expression: $\frac{dx}{dt}$ (representing differential equations).
* A simplified graph/network diagram.
* A lightbulb icon (symbolizing insight/explainability).
* Label: "Explainable model"
### 3. Intermediate Component: Dependency Matrix
* **Visual Representation:** A $3 \times 3$ grid (matrix) colored in light blue.
* **Label:** "Dependency Matrix $C$"
* **Flow:** This matrix is derived directly from the Explainable model.
### 4. Output Component
* **Container:** A dashed rectangular box.
* **Header Text:** **Multiple Tasks** (in green font).
* **Task Breakdown:**
* **Task 1:** *Anomaly detection* (derived from output $y$).
* **Task 2:** *Classification*: *Measurement* anomaly or *cyber* anomaly? (indicated with a red question mark; derived from the Dependency Matrix).
* **Task 3:** *Root Cause localization*: $x_0$ or $x_1$ or $x_2$? (indicated with a red question mark; derived from the Dependency Matrix).
---
## Summary of Key Differences
| Feature | (a) Black Box Model | (b) ICODE (Proposed) |
| :--- | :--- | :--- |
| **Transparency** | Opaque ("???") | Explainable ($\frac{dx}{dt}$, lightbulb) |
| **Task Capacity** | Single Task | Multiple Tasks (Simultaneous) |
| **Output Detail** | Binary/Limited choice | Detailed classification and localization |
| **Intermediate Data** | None shown | Dependency Matrix $C$ |
| **Mathematical Basis** | Neural Network | Differential Equations/Dynamics |