## Heatmap: Coverage Matrix of Different Generation and Refinement Methods
### Overview
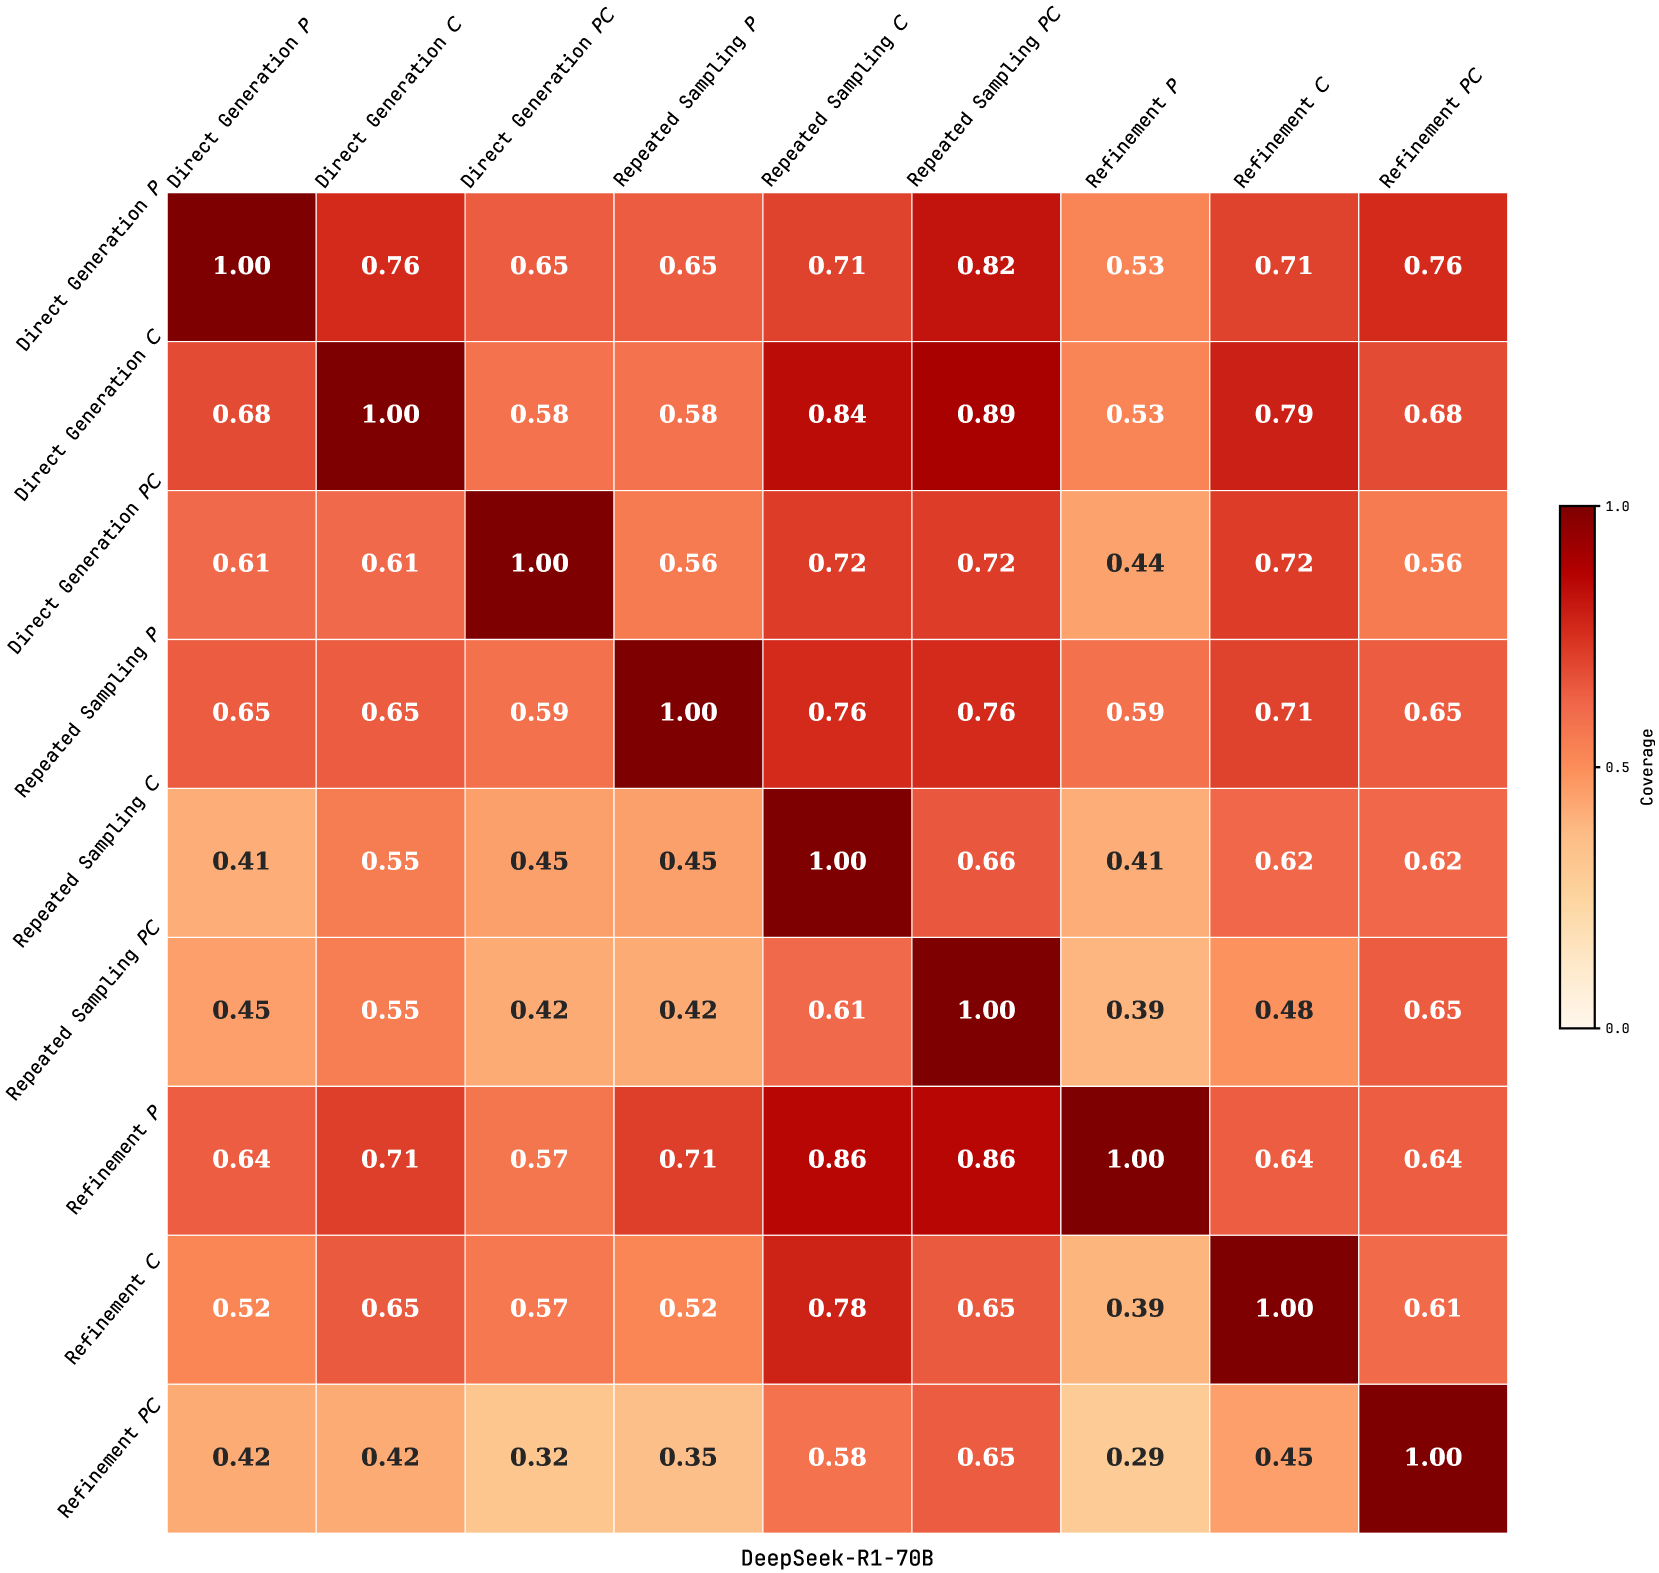
The image is a heatmap displaying the coverage between different methods of generation and refinement. The methods include "Direct Generation," "Repeated Sampling," and "Refinement," each with three variants: "P," "C," and "PC." The heatmap uses a color gradient from light yellow (0.0) to dark red (1.0) to represent the coverage score. The matrix is symmetrical along the diagonal, where each method compared to itself has a coverage of 1.0. The heatmap is generated by "DeepSeek-R1-70B".
### Components/Axes
* **X-axis (Top)**: Lists the generation/refinement methods: "Direct Generation P," "Direct Generation C," "Direct Generation PC," "Repeated Sampling P," "Repeated Sampling C," "Repeated Sampling PC," "Refinement P," "Refinement C," "Refinement PC."
* **Y-axis (Left)**: Lists the same generation/refinement methods as the X-axis, in the same order.
* **Color Scale (Right)**: A vertical color bar labeled "Coverage" ranging from 0.0 (light yellow) to 1.0 (dark red).
### Detailed Analysis or Content Details
Here's a breakdown of the coverage values between different methods:
* **Direct Generation P:**
* vs. Direct Generation P: 1.00
* vs. Direct Generation C: 0.76
* vs. Direct Generation PC: 0.65
* vs. Repeated Sampling P: 0.65
* vs. Repeated Sampling C: 0.71
* vs. Repeated Sampling PC: 0.82
* vs. Refinement P: 0.53
* vs. Refinement C: 0.71
* vs. Refinement PC: 0.76
* **Direct Generation C:**
* vs. Direct Generation P: 0.68
* vs. Direct Generation C: 1.00
* vs. Direct Generation PC: 0.58
* vs. Repeated Sampling P: 0.58
* vs. Repeated Sampling C: 0.84
* vs. Repeated Sampling PC: 0.89
* vs. Refinement P: 0.53
* vs. Refinement C: 0.79
* vs. Refinement PC: 0.68
* **Direct Generation PC:**
* vs. Direct Generation P: 0.61
* vs. Direct Generation C: 0.61
* vs. Direct Generation PC: 1.00
* vs. Repeated Sampling P: 0.56
* vs. Repeated Sampling C: 0.72
* vs. Repeated Sampling PC: 0.72
* vs. Refinement P: 0.44
* vs. Refinement C: 0.72
* vs. Refinement PC: 0.56
* **Repeated Sampling P:**
* vs. Direct Generation P: 0.65
* vs. Direct Generation C: 0.65
* vs. Direct Generation PC: 0.59
* vs. Repeated Sampling P: 1.00
* vs. Repeated Sampling C: 0.76
* vs. Repeated Sampling PC: 0.76
* vs. Refinement P: 0.59
* vs. Refinement C: 0.71
* vs. Refinement PC: 0.65
* **Repeated Sampling C:**
* vs. Direct Generation P: 0.41
* vs. Direct Generation C: 0.55
* vs. Direct Generation PC: 0.45
* vs. Repeated Sampling P: 0.45
* vs. Repeated Sampling C: 1.00
* vs. Repeated Sampling PC: 0.66
* vs. Refinement P: 0.41
* vs. Refinement C: 0.62
* vs. Refinement PC: 0.62
* **Repeated Sampling PC:**
* vs. Direct Generation P: 0.45
* vs. Direct Generation C: 0.55
* vs. Direct Generation PC: 0.42
* vs. Repeated Sampling P: 0.42
* vs. Repeated Sampling C: 0.61
* vs. Repeated Sampling PC: 1.00
* vs. Refinement P: 0.39
* vs. Refinement C: 0.48
* vs. Refinement PC: 0.65
* **Refinement P:**
* vs. Direct Generation P: 0.64
* vs. Direct Generation C: 0.71
* vs. Direct Generation PC: 0.57
* vs. Repeated Sampling P: 0.71
* vs. Repeated Sampling C: 0.86
* vs. Repeated Sampling PC: 0.86
* vs. Refinement P: 1.00
* vs. Refinement C: 0.64
* vs. Refinement PC: 0.64
* **Refinement C:**
* vs. Direct Generation P: 0.52
* vs. Direct Generation C: 0.65
* vs. Direct Generation PC: 0.57
* vs. Repeated Sampling P: 0.52
* vs. Repeated Sampling C: 0.78
* vs. Repeated Sampling PC: 0.65
* vs. Refinement P: 0.39
* vs. Refinement C: 1.00
* vs. Refinement PC: 0.61
* **Refinement PC:**
* vs. Direct Generation P: 0.42
* vs. Direct Generation C: 0.42
* vs. Direct Generation PC: 0.32
* vs. Repeated Sampling P: 0.35
* vs. Repeated Sampling C: 0.58
* vs. Repeated Sampling PC: 0.65
* vs. Refinement P: 0.29
* vs. Refinement C: 0.45
* vs. Refinement PC: 1.00
### Key Observations
* The diagonal elements are all 1.0, indicating perfect coverage when a method is compared to itself.
* "Direct Generation C" and "Repeated Sampling PC" show relatively high coverage scores when compared to other methods.
* "Refinement PC" generally has lower coverage scores when compared to other methods, except for itself.
* The "P" variants generally have lower coverage when compared to "C" and "PC" variants.
### Interpretation
The heatmap visualizes the relationships between different generation and refinement methods in terms of coverage. A higher coverage score suggests a stronger similarity or overlap between the outputs of the two methods being compared. The data suggests that "Direct Generation C" and "Repeated Sampling PC" may produce outputs that are more similar to a wider range of other methods, while "Refinement PC" may be more distinct. The lower coverage scores for "Refinement PC" could indicate that it generates more specialized or unique outputs compared to the other methods. The differences in coverage between "P," "C," and "PC" variants may reflect the impact of different parameter settings or configurations on the generated outputs.