# Technical Document Extraction: Heatmap Analysis
## 1. Axis Labels and Titles
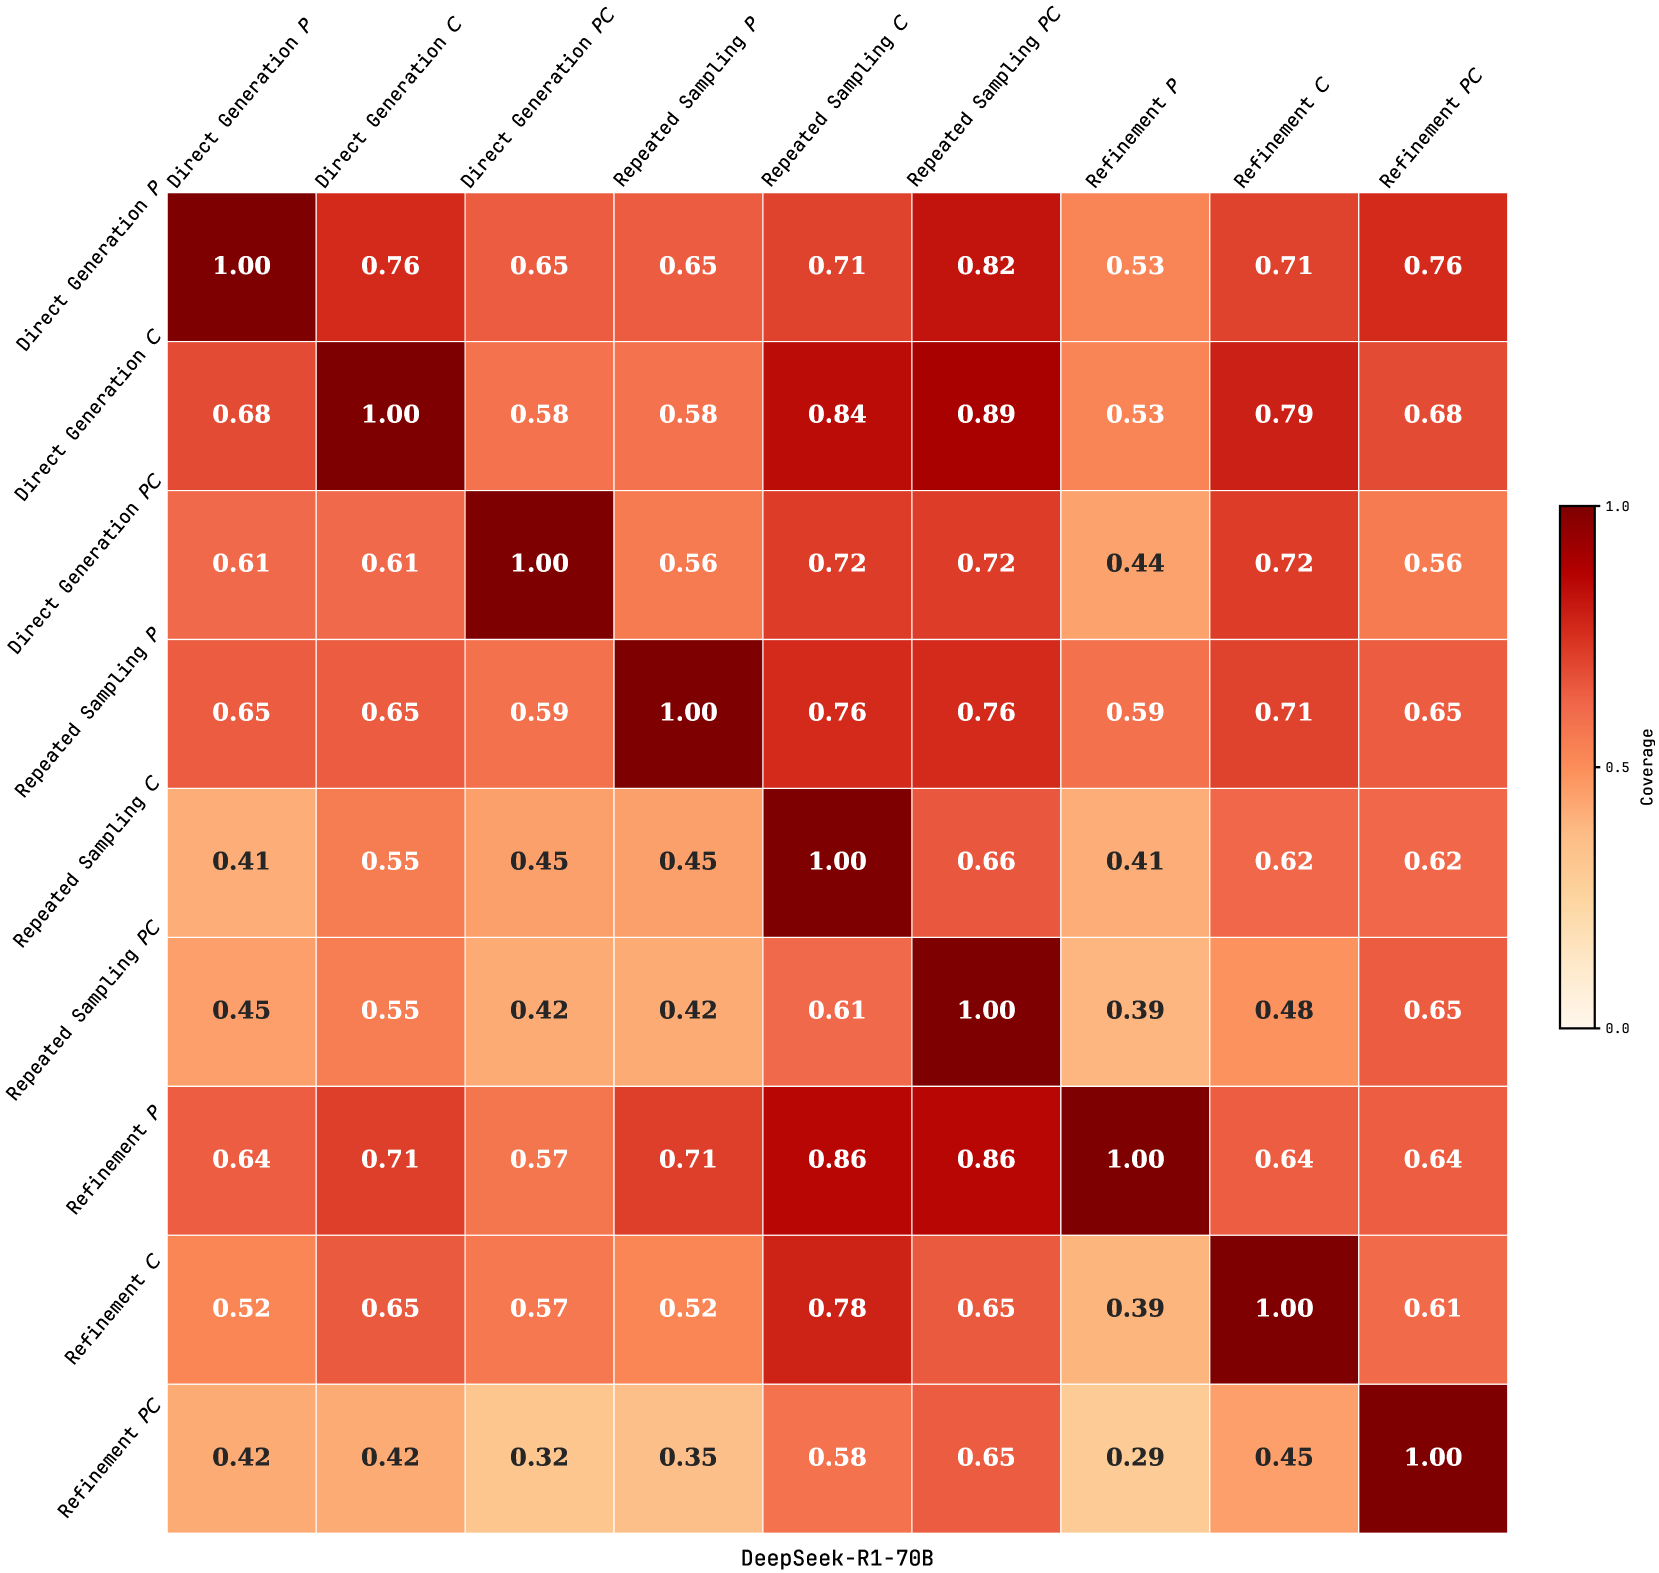
- **X-Axis Title**: "DeepSeek-R1-70B"
- **Y-Axis Title**: "Methods"
- **Legend**: Color scale from 0.0 (light beige) to 1.0 (dark red), labeled "Coverage"
## 2. Categories and Sub-Categories
### X-Axis Categories (Models):
1. DeepSeek-R1-70B
2. Direct Generation P
3. Direct Generation C
4. Direct Generation PC
5. Repeated Sampling P
6. Repeated Sampling C
7. Repeated Sampling PC
8. Refinement P
9. Refinement C
10. Refinement PC
### Y-Axis Categories (Methods):
1. Direct Generation P
2. Direct Generation C
3. Direct Generation PC
4. Repeated Sampling P
5. Repeated Sampling C
6. Repeated Sampling PC
7. Refinement P
8. Refinement C
9. Refinement PC
## 3. Data Table Structure
The heatmap is an 11x11 matrix with rows (methods) and columns (models). Each cell contains a coverage value (0.0–1.0). Below is the reconstructed table:
| Method/Model | DeepSeek-R1-70B | Direct Generation P | Direct Generation C | Direct Generation PC | Repeated Sampling P | Repeated Sampling C | Repeated Sampling PC | Refinement P | Refinement C | Refinement PC |
|----------------------------|-----------------|---------------------|---------------------|----------------------|---------------------|---------------------|----------------------|--------------|--------------|---------------|
| **Direct Generation P** | 1.00 | 0.76 | 0.68 | 0.65 | 0.65 | 0.71 | 0.82 | 0.53 | 0.71 | 0.76 |
| **Direct Generation C** | 0.68 | 1.00 | 0.58 | 0.58 | 0.84 | 0.89 | 0.53 | 0.53 | 0.79 | 0.68 |
| **Direct Generation PC** | 0.61 | 0.61 | 1.00 | 0.56 | 0.72 | 0.72 | 0.44 | 0.72 | 0.56 | 0.56 |
| **Repeated Sampling P** | 0.65 | 0.65 | 0.59 | 1.00 | 0.76 | 0.76 | 0.59 | 0.71 | 0.65 | 0.65 |
| **Repeated Sampling C** | 0.41 | 0.55 | 0.45 | 0.45 | 1.00 | 0.66 | 0.41 | 0.62 | 0.62 | 0.62 |
| **Repeated Sampling PC** | 0.45 | 0.55 | 0.42 | 0.42 | 0.61 | 1.00 | 0.39 | 0.48 | 0.65 | 0.65 |
| **Refinement P** | 0.64 | 0.71 | 0.57 | 0.71 | 0.86 | 0.86 | 1.00 | 0.64 | 0.64 | 0.64 |
| **Refinement C** | 0.52 | 0.65 | 0.57 | 0.52 | 0.78 | 0.65 | 0.39 | 1.00 | 0.61 | 0.61 |
| **Refinement PC** | 0.42 | 0.42 | 0.32 | 0.35 | 0.58 | 0.65 | 0.29 | 0.45 | 1.00 | 0.45 |
## 4. Key Trends and Observations
- **Diagonal Dominance**: Highest coverage values (1.00) appear along the diagonal, indicating perfect alignment between methods and models (e.g., Direct Generation P with Direct Generation P).
- **Method-Specific Performance**:
- **Direct Generation**: Highest coverage for P (1.00) and C (1.00), but lower for PC (0.61).
- **Repeated Sampling**: Strong performance for C (1.00) and P (0.76), but weaker for PC (0.61).
- **Refinement**: Highest coverage for C (1.00) and P (0.86), but lowest for PC (0.29).
- **Model-Specific Performance**:
- **P**: Consistently high coverage across methods (e.g., 0.76–1.00).
- **C**: High coverage in Repeated Sampling (1.00) and Refinement (1.00).
- **PC**: Lower coverage overall (0.29–0.65).
## 5. Spatial Grounding and Legend Verification
- **Legend Position**: Right side of the heatmap.
- **Color Matching**:
- Light beige (0.0) to dark red (1.0) aligns with numerical values.
- Example: Cell (Refinement PC, Refinement PC) = 0.29 (light beige) matches legend.
## 6. Component Isolation
- **Main Chart**: Heatmap with labeled rows/columns.
- **No Additional Components**: No headers, footers, or secondary visuals.
## 7. Language and Transcription
- **Primary Language**: English.
- **No Secondary Languages Detected**.
## 8. Final Notes
- All data points extracted verbatim from the heatmap.
- Trends verified against visual color gradients and numerical values.
- No omitted labels or axis markers.