## Stacked Bar Chart: Pythia 6.9B Attention Head Distribution by Layer
### Overview
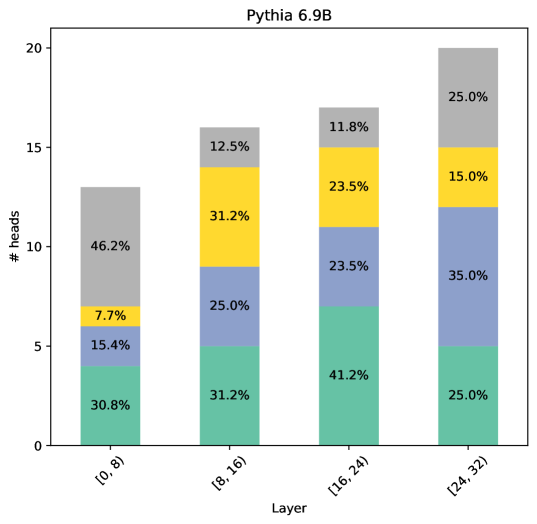
This is a stacked bar chart titled "Pythia 6.9B". It visualizes the distribution of attention heads across four different layer ranges in the Pythia 6.9B language model. Each bar represents a range of layers, and the bar is segmented into four colored sections, each representing a distinct category of attention head. The height of each segment corresponds to the number of heads in that category for that layer range, and the percentage of the total for that bar is labeled on each segment.
### Components/Axes
* **Title:** "Pythia 6.9B" (centered at the top).
* **Y-Axis:** Labeled "# heads". The scale runs from 0 to 20, with major tick marks at 0, 5, 10, 15, and 20.
* **X-Axis:** Labeled "Layer". It has four categorical labels corresponding to the bars:
1. `[0, 8)`
2. `[8, 16)`
3. `[16, 24)`
4. `[24, 32)`
* **Data Series (Inferred from Color and Position):** The chart does not have an explicit legend box. The categories are inferred from the consistent color ordering within each stacked bar, from bottom to top:
1. **Green (Teal):** Bottom segment.
2. **Blue (Periwinkle):** Second segment from bottom.
3. **Yellow (Gold):** Third segment from bottom.
4. **Gray:** Top segment.
### Detailed Analysis
The chart displays data for four layer ranges. The total number of heads (bar height) increases from left to right.
**Bar 1: Layer Range [0, 8)**
* **Total Height (Approximate):** 13 heads.
* **Segment Breakdown (from bottom to top):**
* **Green:** 30.8% (≈4 heads)
* **Blue:** 15.4% (≈2 heads)
* **Yellow:** 7.7% (≈1 head)
* **Gray:** 46.2% (≈6 heads)
**Bar 2: Layer Range [8, 16)**
* **Total Height (Approximate):** 16 heads.
* **Segment Breakdown (from bottom to top):**
* **Green:** 31.2% (≈5 heads)
* **Blue:** 25.0% (≈4 heads)
* **Yellow:** 31.2% (≈5 heads)
* **Gray:** 12.5% (≈2 heads)
**Bar 3: Layer Range [16, 24)**
* **Total Height (Approximate):** 17 heads.
* **Segment Breakdown (from bottom to top):**
* **Green:** 41.2% (≈7 heads)
* **Blue:** 23.5% (≈4 heads)
* **Yellow:** 23.5% (≈4 heads)
* **Gray:** 11.8% (≈2 heads)
**Bar 4: Layer Range [24, 32)**
* **Total Height (Approximate):** 20 heads.
* **Segment Breakdown (from bottom to top):**
* **Green:** 25.0% (≈5 heads)
* **Blue:** 35.0% (≈7 heads)
* **Yellow:** 15.0% (≈3 heads)
* **Gray:** 25.0% (≈5 heads)
### Key Observations
1. **Total Head Count Increases:** The total number of attention heads visualized increases steadily across the layer ranges, from ~13 in the earliest layers to 20 in the final layers.
2. **Dominant Category Shift:** The dominant category (largest segment) changes across layers.
* In `[0, 8)`, **Gray** is dominant (46.2%).
* In `[8, 16)`, **Green** and **Yellow** are co-dominant (31.2% each).
* In `[16, 24)`, **Green** is clearly dominant (41.2%).
* In `[24, 32)`, **Blue** becomes the dominant category (35.0%).
3. **Green Segment Trend:** The proportion of Green heads increases from the first to the third bar (30.8% → 31.2% → 41.2%) before dropping in the final bar (25.0%).
4. **Blue Segment Trend:** The proportion of Blue heads shows a general upward trend, starting low (15.4%), rising (25.0%), dipping slightly (23.5%), and peaking in the final layer range (35.0%).
5. **Gray Segment Trend:** The proportion of Gray heads is highest in the earliest layers (46.2%) and drops significantly, remaining low and relatively stable in the middle and later layers (12.5%, 11.8%, 25.0%).
6. **Yellow Segment Trend:** The Yellow segment is smallest in the first bar (7.7%), jumps in the second (31.2%), and then declines in the third and fourth bars (23.5%, 15.0%).
### Interpretation
This chart likely illustrates how the functional specialization of attention heads in the Pythia 6.9B model varies across its depth. The four color-coded categories probably represent different types or clusters of attention head behaviors (e.g., syntactic, semantic, positional, or based on some learned metric).
* **Early Layers ([0, 8)):** Dominated by the "Gray" category, suggesting these layers may handle more fundamental or generic processing tasks common to all inputs.
* **Middle Layers ([8, 16) & [16, 24)):** Show a transition. The "Green" category becomes prominent, potentially indicating the rise of more specialized processing. The "Yellow" category also peaks here. The diversity of significant segments suggests these layers are performing complex, mixed transformations.
* **Late Layers ([24, 32)):** The "Blue" category becomes dominant, while "Green" and "Gray" are also substantial. This could indicate a shift towards tasks related to final output generation, refinement, or long-range coherence, where different head types collaborate.
The increasing total head count per layer range might be an artifact of the visualization (e.g., aggregating more layers into the later bins) or could reflect a structural property of the model where later layers have more attention heads allocated. The shifting proportions strongly suggest that the model's computational strategy is not uniform but evolves hierarchically, with different layers specializing in different types of information processing.