## Multi-Panel Figure: Training Dynamics and Fault Injection Analysis
### Overview
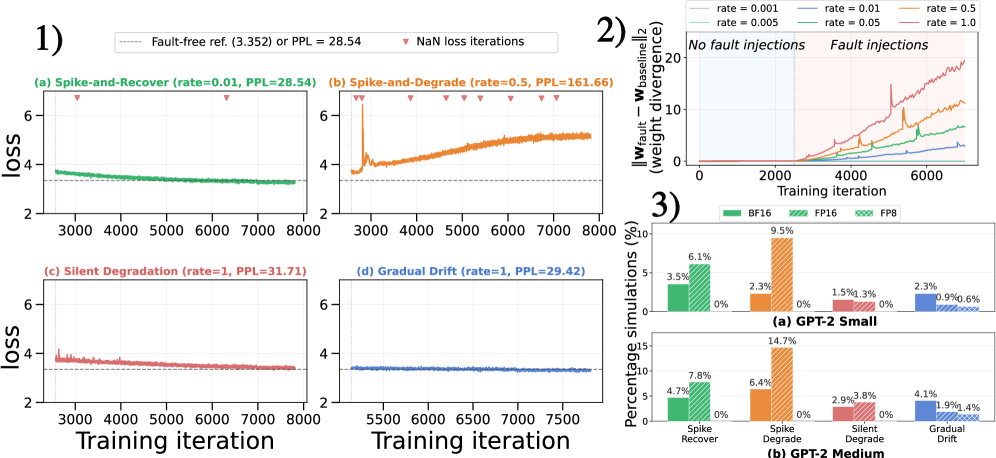
The image presents a multi-panel technical analysis of model training dynamics under various fault injection scenarios. It includes four line graphs (1a-d), a weight divergence comparison (2), and two bar charts (3a-b) comparing fault simulation frequencies across model sizes.
### Components/Axes
**1) Training Loss Dynamics (Subplots 1a-1d):**
- **X-axis**: Training iteration (0-8000)
- **Y-axis**: Loss value (2-6)
- **Legends**: Located top-left of each subplot
- Fault-free reference (dotted line, loss=3.352, PPL=28.54)
- NaN loss iterations (red triangles)
- **Subplot Labels**:
- (a) Spike-and-Recover (rate=0.01, PPL=28.54)
- (b) Spike-and-Degrade (rate=0.5, PPL=161.66)
- (c) Silent Degradation (rate=1, PPL=31.71)
- (d) Gradual Drift (rate=1, PPL=29.42)
**2) Weight Divergence Comparison (Subplot 2):**
- **X-axis**: Training iteration (0-6000)
- **Y-axis**: L2 norm of weight difference (0-10)
- **Legend**: Top-left, color-coded fault rates (0.001-1.0)
- **Lines**:
- Dashed: Fault-free baseline
- Solid: Fault-injected scenarios (rates 0.001-1.0)
**3) Fault Simulation Frequencies (Subplots 3a-3b):**
- **X-axis**: Fault types (Spike Recover, Spike Degrade, Silent Degradation, Gradual Drift)
- **Y-axis**: Percentage of simulations (%)
- **Models**:
- (a) GPT-2 Small
- (b) GPT-2 Medium
- **Colors**: Green (Spike Recover), Orange (Spike Degrade), Red (Silent Degradation), Blue (Gradual Drift)
### Detailed Analysis
**1a-1d Training Loss Trends:**
- **1a (Spike-and-Recover)**: Green line remains flat at ~3.35 loss (PPL=28.54), matching fault-free reference
- **1b (Spike-and-Degrade)**: Orange line spikes to ~5.5 loss at iteration 1000, then stabilizes (PPL=161.66)
- **1c (Silent Degradation)**: Red line shows initial fluctuation (~4.5 loss) before stabilizing (PPL=31.71)
- **1d (Gradual Drift)**: Blue line maintains constant ~3.5 loss (PPL=29.42)
**2) Weight Divergence:**
- Fault-free baseline (dashed) remains near 0
- Fault-injected lines show:
- Rate 0.001: Minimal divergence (~1.5)
- Rate 1.0: Sharp increase to ~8.5 divergence
- Color progression: Blue (lowest rate) to Red (highest rate)
**3a-3b Fault Simulation Frequencies:**
- **GPT-2 Small**:
- Spike Recover: 6.1%
- Spike Degrade: 9.5%
- Silent Degradation: 1.5%
- Gradual Drift: 0.9%
- **GPT-2 Medium**:
- Spike Recover: 4.7%
- Spike Degrade: 6.4%
- Silent Degradation: 2.9%
- Gradual Drift: 4.1%
### Key Observations
1. **Fault Rate Impact**: Higher fault rates correlate with increased loss (1b: 0.5→161.66 PPL) and weight divergence (2: 0.001→1.0 rate)
2. **Model Robustness**: GPT-2 Small shows higher fault simulation frequencies than Medium across all fault types
3. **Training Stability**: Gradual Drift (1d) maintains most stable loss despite high fault rate (1.0)
4. **Anomaly**: Silent Degradation (1c) achieves lower PPL (31.71) than Gradual Drift (29.42) despite similar fault rates
### Interpretation
The data demonstrates that:
- **Training Method Sensitivity**: Spike-and-Degrade (1b) exhibits catastrophic failure (highest PPL) under moderate fault rates, while Gradual Drift (1d) maintains stability
- **Fault Injection Correlation**: Weight divergence increases exponentially with fault rate (2), suggesting fault tolerance degrades with higher error rates
- **Model Architecture Differences**: GPT-2 Small's higher fault simulation frequencies (3a-b) indicate reduced robustness compared to Medium variant
- **Unexpected Finding**: Silent Degradation (1c) achieves better PPL than Gradual Drift despite similar fault rates, suggesting different failure modes
This analysis reveals critical insights into model robustness under fault conditions, with implications for fault-tolerant training methodologies and model architecture design.