\n
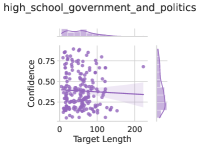
## Scatter Plot: Confidence vs. Target Length (High School Government and Politics)
### Overview
The image presents a scatter plot visualizing the relationship between "Target Length" and "Confidence" for data related to "high_school_government_and_politics". A regression line with a shaded confidence interval is overlaid on the scatter points. A marginal distribution plot is shown above the scatter plot.
### Components/Axes
* **X-axis:** "Target Length" - Scale ranges from approximately 0 to 230.
* **Y-axis:** "Confidence" - Scale ranges from approximately 0.2 to 0.8.
* **Scatter Points:** Purple dots representing individual data points.
* **Regression Line:** A dark purple line representing the trend of the data. It slopes slightly downward.
* **Confidence Interval:** A light purple shaded area around the regression line, indicating the uncertainty in the estimated trend.
* **Marginal Distribution:** A density plot positioned above the scatter plot, showing the distribution of "Target Length".
* **Title:** "high_school_government_and_politics" - positioned at the top-left of the image.
### Detailed Analysis
The scatter plot shows a generally dispersed pattern of points.
* **Trend:** The regression line exhibits a slight negative slope, suggesting that as "Target Length" increases, "Confidence" tends to decrease, but the relationship is weak.
* **Data Points:**
* At "Target Length" = 0, "Confidence" values range from approximately 0.2 to 0.6.
* At "Target Length" = 50, "Confidence" values range from approximately 0.3 to 0.75.
* At "Target Length" = 100, "Confidence" values range from approximately 0.25 to 0.7.
* At "Target Length" = 150, "Confidence" values range from approximately 0.2 to 0.5.
* At "Target Length" = 200, "Confidence" values range from approximately 0.2 to 0.4.
* **Marginal Distribution:** The marginal distribution is unimodal and skewed to the right, with a peak around a "Target Length" of approximately 50-100. The distribution tails off towards higher "Target Length" values.
* **Confidence Interval:** The confidence interval is relatively wide, indicating substantial uncertainty in the estimated regression line.
### Key Observations
* The relationship between "Target Length" and "Confidence" appears weak and potentially non-linear.
* There is considerable variability in "Confidence" for a given "Target Length".
* The marginal distribution suggests that shorter "Target Lengths" are more common in the dataset.
* The wide confidence interval suggests that the observed trend may not be statistically significant.
### Interpretation
The data suggests a very weak negative correlation between the length of the target (presumably a text or response) and the confidence associated with it, within the context of "high_school_government_and_politics". This could imply that longer responses in this domain are less confidently assessed, or that shorter responses are more easily evaluated with higher confidence. However, the weak trend and wide confidence interval suggest that this relationship is not strong or reliable. The marginal distribution indicates that the majority of the data points have relatively short target lengths.
The plot could be used to assess the performance of a model or system that predicts confidence based on target length. The wide confidence interval suggests that the model's predictions are uncertain, especially for longer target lengths. Further investigation would be needed to determine the underlying reasons for the observed patterns and to improve the accuracy of the confidence predictions.