## Chart: Center Accuracy vs. Model Size
### Overview
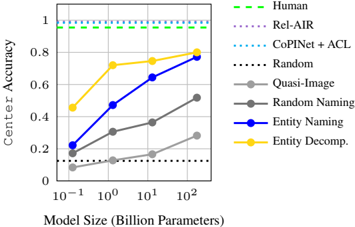
The image is a line chart comparing the center accuracy of different models against their size (in billion parameters). The chart includes several models: Human, Rel-AIR, CoPINet + ACL, Random, Quasi-Image, Random Naming, Entity Naming, and Entity Decomp. The x-axis represents the model size on a logarithmic scale, and the y-axis represents the center accuracy.
### Components/Axes
* **X-axis:** Model Size (Billion Parameters) - logarithmic scale with markers at 10^-1, 10^0, 10^1, and 10^2.
* **Y-axis:** Center Accuracy - linear scale from 0 to 1, with markers at 0, 0.2, 0.4, 0.6, 0.8, and 1.
* **Legend:** Located on the right side of the chart, vertically aligned.
* Human (Green dashed line)
* Rel-AIR (Purple dotted line)
* CoPINet + ACL (Cyan dotted line)
* Random (Black dotted line)
* Quasi-Image (Gray solid line)
* Random Naming (Dark Gray solid line)
* Entity Naming (Blue solid line)
* Entity Decomp. (Yellow solid line)
### Detailed Analysis
* **Human:** (Green dashed line) Constant at approximately 0.98 accuracy.
* **Rel-AIR:** (Purple dotted line) Constant at approximately 0.98 accuracy.
* **CoPINet + ACL:** (Cyan dotted line) Constant at approximately 0.96 accuracy.
* **Random:** (Black dotted line) Constant at approximately 0.12 accuracy.
* **Quasi-Image:** (Gray solid line) Starts at approximately 0.1, increases to approximately 0.2 at 10^0, then to approximately 0.35 at 10^1, and finally to approximately 0.5 at 10^2.
* **Random Naming:** (Dark Gray solid line) Starts at approximately 0.2, increases to approximately 0.3 at 10^0, then to approximately 0.37 at 10^1, and finally to approximately 0.52 at 10^2.
* **Entity Naming:** (Blue solid line) Starts at approximately 0.22, increases to approximately 0.5 at 10^0, then to approximately 0.65 at 10^1, and finally to approximately 0.78 at 10^2.
* **Entity Decomp.:** (Yellow solid line) Starts at approximately 0.46, increases to approximately 0.72 at 10^0, then to approximately 0.75 at 10^1, and finally to approximately 0.82 at 10^2.
### Key Observations
* The "Human", "Rel-AIR", and "CoPINet + ACL" models have significantly higher and relatively constant center accuracy compared to the other models.
* The "Random" model has the lowest and constant center accuracy.
* The "Quasi-Image", "Random Naming", "Entity Naming", and "Entity Decomp." models show increasing center accuracy as the model size increases.
* "Entity Decomp." and "Entity Naming" models have the highest accuracy among the models that increase with size.
### Interpretation
The chart demonstrates the relationship between model size and center accuracy for various models. The "Human", "Rel-AIR", and "CoPINet + ACL" models represent a high baseline, while the "Random" model represents a low baseline. The other models ("Quasi-Image", "Random Naming", "Entity Naming", and "Entity Decomp.") show that increasing model size generally leads to improved center accuracy, suggesting that larger models are better at capturing the relationships needed for higher accuracy. The "Entity Decomp." and "Entity Naming" models appear to be more effective at leveraging increased model size compared to "Quasi-Image" and "Random Naming". The logarithmic scale on the x-axis suggests that the increase in accuracy diminishes as the model size grows larger.