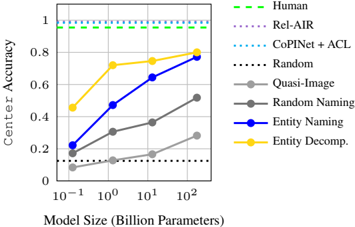
## Line Chart: Center Accuracy vs. Model Size
### Overview
This image presents a line chart illustrating the relationship between "Center Accuracy" and "Model Size (Billion Parameters)" for various methods. The chart compares the performance of different approaches, including human performance, several automated methods, and random baselines.
### Components/Axes
* **X-axis:** "Model Size (Billion Parameters)" with markers at 10<sup>-1</sup>, 10<sup>0</sup>, 10<sup>1</sup>, and 10<sup>2</sup>.
* **Y-axis:** "Center Accuracy" ranging from 0 to 1.
* **Legend (top-right):**
* Human (green, dashed)
* Rel-AIR (black, dotted)
* CoPINet + ACL (cyan, dashed-dotted)
* Random (black, dotted)
* Quasi-Image (gray, solid)
* Random Naming (dark gray, solid)
* Entity Naming (blue, solid)
* Entity Decomp. (yellow, solid)
### Detailed Analysis
The chart displays several lines representing the performance of each method as model size increases.
* **Human:** The green dashed line remains consistently at a Center Accuracy of approximately 1.0 across all model sizes.
* **Rel-AIR:** The black dotted line starts at approximately 0.1 and remains relatively flat, fluctuating around 0.15-0.2 across all model sizes.
* **CoPINet + ACL:** The cyan dashed-dotted line starts at approximately 0.2 and increases to around 0.35 at a model size of 10<sup>1</sup>, then plateaus.
* **Random:** The black dotted line starts at approximately 0.1 and remains relatively flat, fluctuating around 0.15-0.2 across all model sizes.
* **Quasi-Image:** The gray solid line starts at approximately 0.2 and increases to around 0.55 at a model size of 10<sup>1</sup>, then continues to approximately 0.6 at a model size of 10<sup>2</sup>.
* **Random Naming:** The dark gray solid line starts at approximately 0.2 and increases to around 0.4 at a model size of 10<sup>1</sup>, then continues to approximately 0.5 at a model size of 10<sup>2</sup>.
* **Entity Naming:** The blue solid line starts at approximately 0.2 and increases sharply to around 0.65 at a model size of 10<sup>1</sup>, then continues to approximately 0.8 at a model size of 10<sup>2</sup>.
* **Entity Decomp.:** The yellow solid line starts at approximately 0.2 and increases sharply to around 0.75 at a model size of 10<sup>1</sup>, then continues to approximately 0.8 at a model size of 10<sup>2</sup>.
### Key Observations
* Human performance consistently achieves perfect accuracy (1.0).
* The "Entity Naming" and "Entity Decomp." methods show the most significant improvement in Center Accuracy as model size increases.
* "Rel-AIR" and "Random" methods exhibit minimal improvement with increasing model size, remaining near a baseline accuracy of approximately 0.1-0.2.
* "CoPINet + ACL" shows moderate improvement, plateauing at a lower accuracy than "Entity Naming" and "Entity Decomp."
* "Quasi-Image" and "Random Naming" show moderate improvement, but remain below the performance of "Entity Naming" and "Entity Decomp."
### Interpretation
The data suggests that increasing model size significantly improves the performance of "Entity Naming" and "Entity Decomp." methods in terms of Center Accuracy. These methods outperform the other approaches, particularly as the model size grows. The relatively flat performance of "Rel-AIR" and "Random" indicates that these methods do not benefit substantially from larger models. The consistent high accuracy of human performance serves as an upper bound for the automated methods. The chart demonstrates a clear correlation between model size and performance for certain approaches, highlighting the potential benefits of scaling up models for tasks involving entity recognition or decomposition. The plateauing of "CoPINet + ACL" suggests that its performance may be limited by factors other than model size. The difference between "Entity Naming" and "Entity Decomp." is minimal, suggesting they are similarly effective.