## Heatmap: Accuracy
### Overview
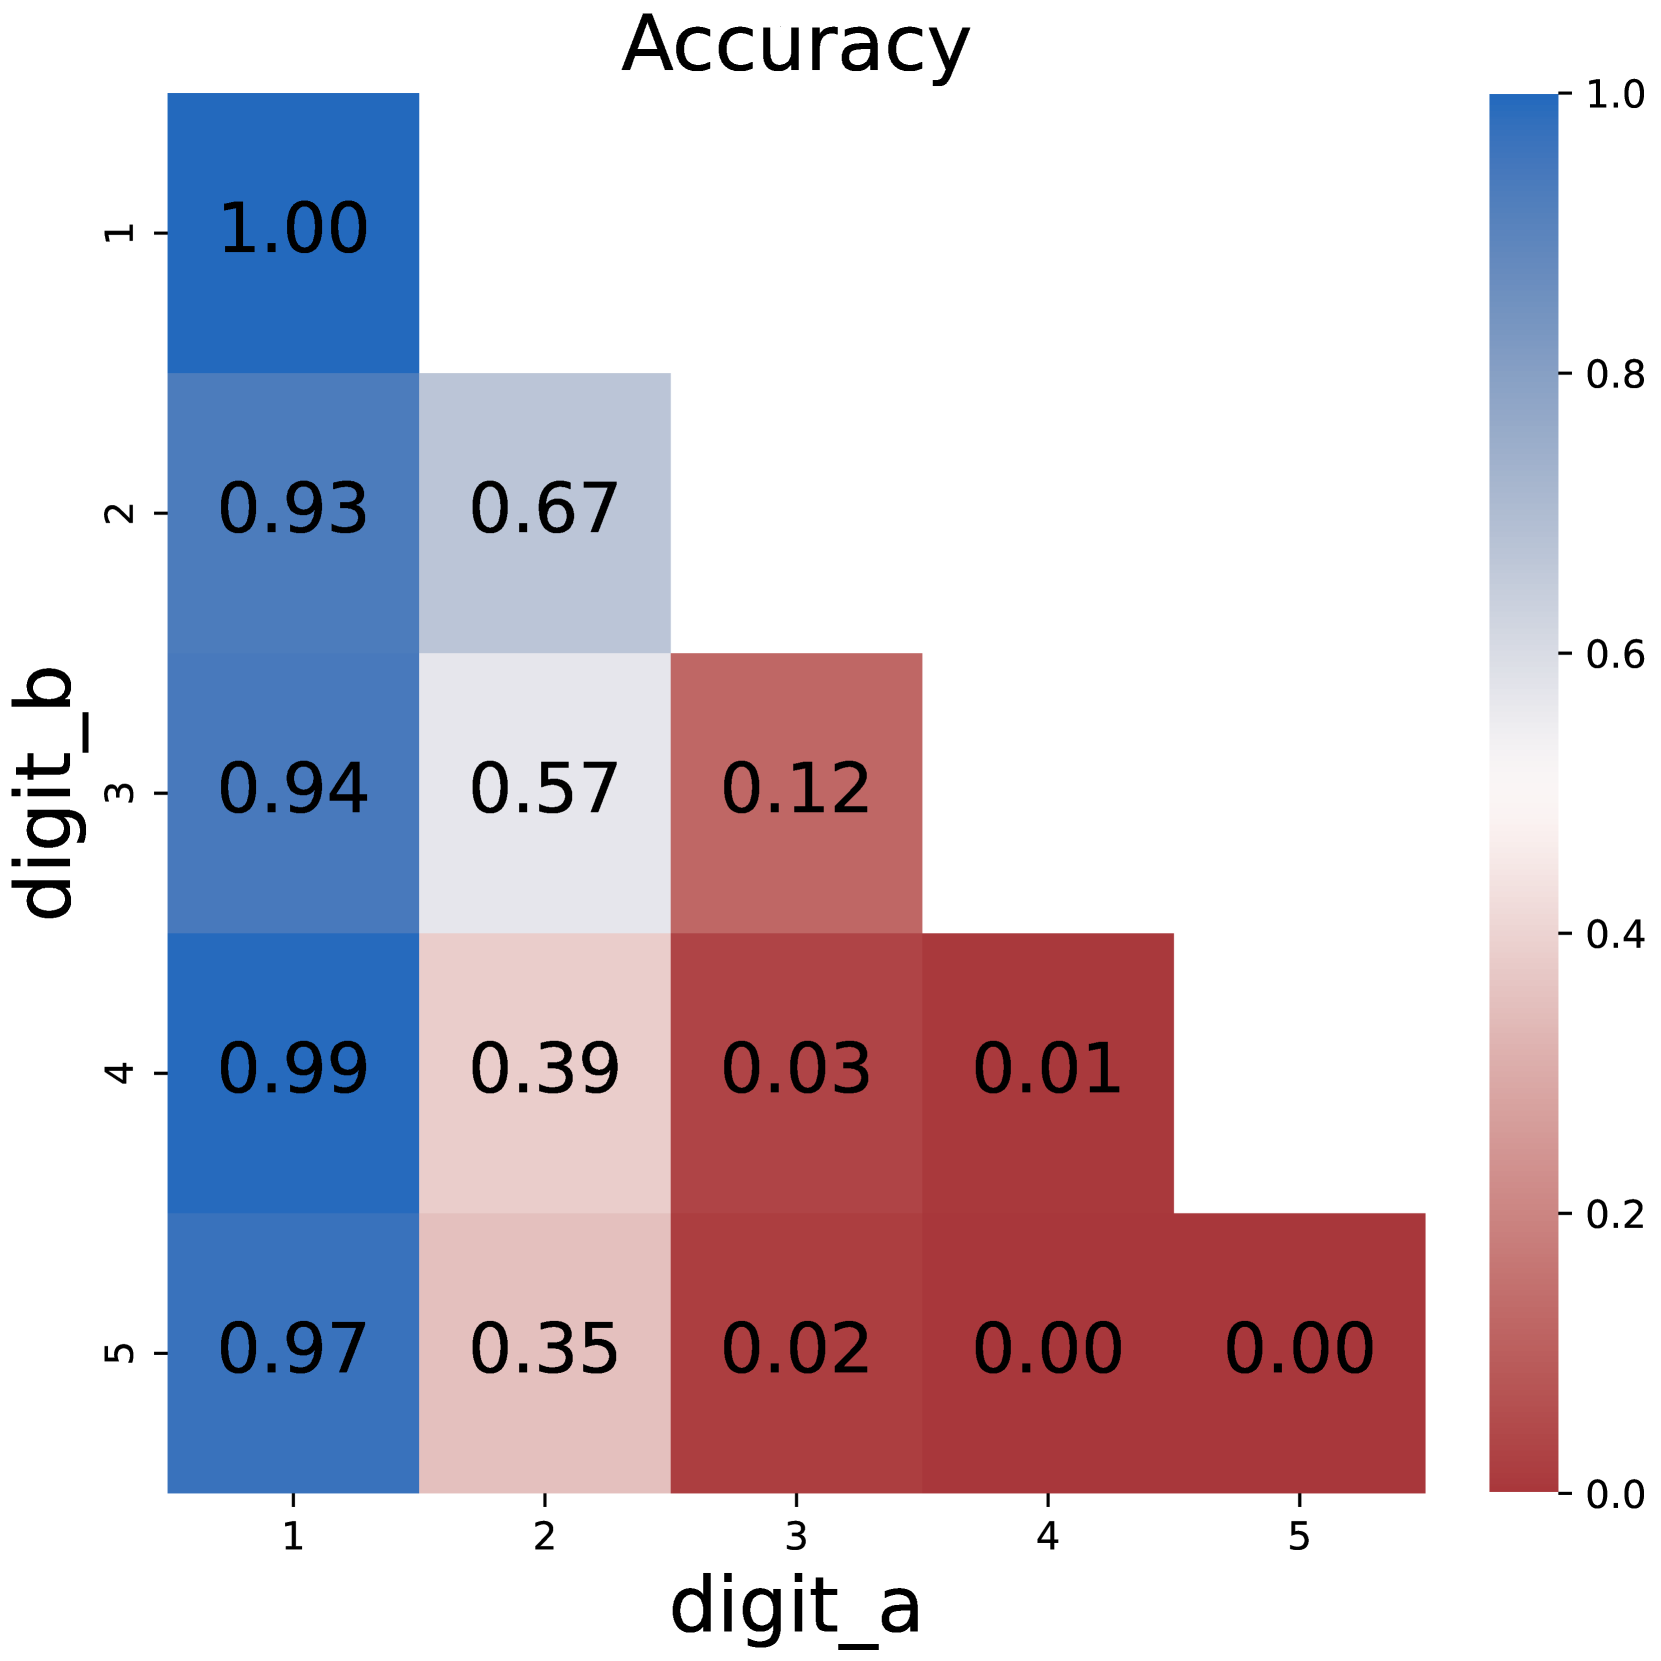
This image presents a heatmap visualizing the accuracy of a digit recognition system, specifically how well it confuses one digit for another. The heatmap displays accuracy values ranging from 0.0 to 1.0, with darker blues representing higher accuracy and darker reds representing lower accuracy. The axes represent the 'true' digit (digit_a) and the 'predicted' digit (digit_b).
### Components/Axes
* **Title:** "Accuracy" - positioned at the top-center of the image.
* **X-axis Label:** "digit\_a" - representing the actual digit. Markers are 1, 2, 3, 4, and 5.
* **Y-axis Label:** "digit\_b" - representing the predicted digit. Markers are 1, 2, 3, 4, and 5.
* **Colorbar/Legend:** Located on the right side of the heatmap. It shows a gradient from blue (0.0) to red (1.0), representing the accuracy scale. The colorbar has markers at 0.0, 0.2, 0.4, 0.6, 0.8, and 1.0.
### Detailed Analysis
The heatmap is a 5x5 grid. Each cell represents the accuracy of predicting digit 'b' when the actual digit is 'a'. I will analyze row by row, referencing the legend to confirm color-accuracy correspondence.
* **Row 1 (digit\_a = 1):**
* digit\_b = 1: 1.00 (Dark Blue)
* digit\_b = 2: 0.93 (Light Blue)
* digit\_b = 3: 0.94 (Light Blue)
* digit\_b = 4: 0.99 (Dark Blue)
* digit\_b = 5: 0.97 (Light Blue)
* **Row 2 (digit\_a = 2):**
* digit\_b = 1: 0.67 (Light Grey)
* digit\_b = 2: 0.93 (Light Blue)
* digit\_b = 3: 0.57 (Grey)
* digit\_b = 4: 0.39 (Light Red)
* digit\_b = 5: 0.35 (Light Red)
* **Row 3 (digit\_a = 3):**
* digit\_b = 1: 0.12 (Red)
* digit\_b = 2: 0.57 (Grey)
* digit\_b = 3: 0.94 (Light Blue)
* digit\_b = 4: 0.03 (Dark Red)
* digit\_b = 5: 0.02 (Dark Red)
* **Row 4 (digit\_a = 4):**
* digit\_b = 1: 0.01 (Dark Red)
* digit\_b = 2: 0.39 (Light Red)
* digit\_b = 3: 0.03 (Dark Red)
* digit\_b = 4: 0.99 (Dark Blue)
* digit\_b = 5: 0.00 (Dark Red)
* **Row 5 (digit\_a = 5):**
* digit\_b = 1: 0.00 (Dark Red)
* digit\_b = 2: 0.35 (Light Red)
* digit\_b = 3: 0.02 (Dark Red)
* digit\_b = 4: 0.00 (Dark Red)
* digit\_b = 5: 0.97 (Light Blue)
### Key Observations
* The diagonal elements (where digit\_a = digit\_b) all have very high accuracy (close to 1.0), indicating the system correctly identifies digits most of the time.
* The system frequently confuses '3' for '1' and '2' (low accuracy values in the first column of row 3).
* The system frequently confuses '4' for '1', '2', '3', and '5' (low accuracy values in the first four columns of row 4).
* The system frequently confuses '5' for '1', '2', '3', and '4' (low accuracy values in the first four columns of row 5).
* The confusion matrix is not symmetrical. For example, the accuracy of predicting '2' given '1' (0.67) is different from predicting '1' given '2' (0.93).
### Interpretation
This heatmap represents a confusion matrix for a digit recognition model. It demonstrates the model's performance in classifying handwritten digits. The high accuracy along the diagonal indicates the model is generally good at recognizing digits when they are clearly presented. However, the lower accuracy values off-diagonal reveal specific areas of confusion.
The model struggles to differentiate between '3', '4', and '5', as evidenced by the low accuracy values when predicting these digits given other inputs. This suggests that these digits may have similar features in the dataset, leading to misclassification. The asymmetry in the confusion matrix suggests that the model may be biased towards certain digits or have different sensitivities to variations in their shapes.
The heatmap provides valuable insights for improving the model. Further analysis of the misclassified samples could reveal common patterns or features that contribute to the errors. This information can be used to refine the model's training data or architecture to enhance its accuracy and robustness.