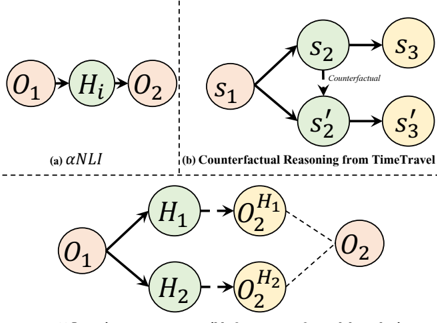
## Diagram: Causal Reasoning Diagrams
### Overview
The image presents three diagrams illustrating different types of causal reasoning. The diagrams use nodes (circles) to represent states or events and arrows to represent causal relationships. The diagrams are labeled (a) αNLI, (b) Counterfactual Reasoning from TimeTravel, and (c) a third diagram with branching causal paths.
### Components/Axes
* **Nodes:** Represented by circles, labeled with letters and numbers (e.g., O1, H1, S2). The color of the nodes varies between a light peach and a light green.
* **Arrows:** Indicate causal relationships between nodes. Solid arrows represent direct causal links, while dashed arrows represent potential or counterfactual links.
* **Labels:** Each diagram has a title indicating the type of reasoning it represents.
* **Counterfactual Label:** In diagram (b), the word "Counterfactual" is written near the arrow that splits from node S2 to node S2'.
### Detailed Analysis
**Diagram (a): αNLI**
* Nodes: O1 (peach), Hi (green), O2 (peach)
* Arrows: O1 -> Hi -> O2
* Description: A linear causal chain where O1 causes Hi, which in turn causes O2.
**Diagram (b): Counterfactual Reasoning from TimeTravel**
* Nodes: S1 (peach), S2 (green), S3 (peach), S2' (green), S3' (peach)
* Arrows: S1 -> S2 -> S3, S1 -> S2' -> S3', S2 -> S2' (labeled "Counterfactual")
* Description: A branching causal diagram. S1 leads to S2 and S3. A counterfactual scenario is introduced where S2 could have led to S2' and S3' instead.
**Diagram (c): Branching Causal Paths**
* Nodes: O1 (peach), H1 (green), H2 (green), O2^H1_2 (peach), O2^H2_2 (peach), O2 (peach)
* Arrows: O1 -> H1 -> O2^H1_2, O1 -> H2 -> O2^H2_2, O2^H1_2 --> O2 (dashed), O2^H2_2 --> O2 (dashed)
* Description: O1 branches into two paths, one leading to H1 and then to O2^H1_2, and the other leading to H2 and then to O2^H2_2. Both O2^H1_2 and O2^H2_2 potentially lead to O2, indicated by dashed arrows.
### Key Observations
* Diagrams (a) and (b) have a clear separation due to a vertical dashed line.
* Diagram (b) introduces the concept of counterfactual reasoning, where an alternative outcome is considered.
* Diagram (c) shows a branching causal structure with potential outcomes converging to a single final state.
* The use of dashed arrows in diagram (c) indicates potential or less certain causal links.
### Interpretation
The diagrams illustrate different ways of representing causal relationships and reasoning. Diagram (a) shows a simple linear causal chain. Diagram (b) introduces counterfactual reasoning, which is essential for understanding alternative possibilities and hypothetical scenarios. Diagram (c) shows a more complex branching causal structure, where multiple paths can lead to the same outcome. These diagrams are useful for modeling and analyzing complex systems where multiple factors can influence the outcome. The use of different arrow types (solid vs. dashed) helps to distinguish between direct and potential causal links. The diagrams are likely used to explain or visualize causal inference methods in a technical context.