## Charts: Network Training Analysis
### Overview
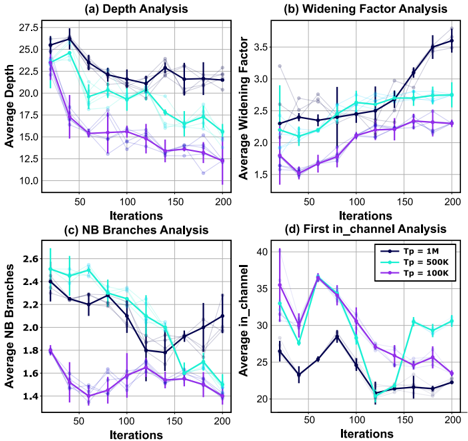
The image contains four separate line charts, arranged in a 2x2 grid. Each chart analyzes a different metric related to network training over iterations. The metrics are Depth, Widening Factor, Number of Branches (NB Branches), and First_in_channel. Each chart displays three lines representing different values of Tp (1M, 500k, 100k), with error bars indicating variance.
### Components/Axes
Each chart shares the following components:
* **X-axis:** Iterations, ranging from 0 to 200, with markings every 50 iterations.
* **Y-axis:** Varies depending on the chart, representing the metric being analyzed.
* **Legend:** Located in the top-right corner of each chart, indicating the line colors corresponding to Tp values:
* Tp = 1M (Dark Turquoise)
* Tp = 500k (Cyan)
* Tp = 100k (Purple)
* **Titles:** Each chart has a title indicating the analysis being performed:
* (a) Depth Analysis
* (b) Widening Factor Analysis
* (c) NB Branches Analysis
* (d) First_in_channel Analysis
### Detailed Analysis
**Chart (a): Depth Analysis**
* **Trend:** All three lines initially decrease, then plateau and fluctuate. The Tp = 1M line starts highest and decreases most rapidly.
* **Data Points (approximate):**
* Tp = 1M: Starts at ~26, decreases to ~18 at iteration 50, fluctuates between ~18 and ~24 until iteration 200, ending at ~24.
* Tp = 500k: Starts at ~25, decreases to ~16 at iteration 50, fluctuates between ~16 and ~22 until iteration 200, ending at ~20.
* Tp = 100k: Starts at ~24, decreases to ~14 at iteration 50, fluctuates between ~14 and ~19 until iteration 200, ending at ~17.
**Chart (b): Widening Factor Analysis**
* **Trend:** The Tp = 1M line shows a clear upward trend, while the other two lines are relatively stable with some fluctuations.
* **Data Points (approximate):**
* Tp = 1M: Starts at ~1.6, increases steadily to ~3.5 at iteration 200.
* Tp = 500k: Fluctuates around ~2.5, ranging from ~2.2 to ~2.8 throughout the iterations.
* Tp = 100k: Fluctuates around ~2.0, ranging from ~1.8 to ~2.3 throughout the iterations.
**Chart (c): NB Branches Analysis**
* **Trend:** All three lines initially decrease, then plateau and fluctuate. The Tp = 500k line shows the most pronounced decrease.
* **Data Points (approximate):**
* Tp = 1M: Starts at ~2.5, decreases to ~1.8 at iteration 50, fluctuates between ~1.8 and ~2.4 until iteration 200, ending at ~2.2.
* Tp = 500k: Starts at ~2.5, decreases to ~1.5 at iteration 50, fluctuates between ~1.5 and ~2.1 until iteration 200, ending at ~1.9.
* Tp = 100k: Starts at ~2.4, decreases to ~1.7 at iteration 50, fluctuates between ~1.7 and ~2.3 until iteration 200, ending at ~2.1.
**Chart (d): First_in_channel Analysis**
* **Trend:** All three lines show fluctuating patterns with no clear overall trend. The Tp = 1M line generally has higher values.
* **Data Points (approximate):**
* Tp = 1M: Fluctuates between ~25 and ~40 throughout the iterations.
* Tp = 500k: Fluctuates between ~20 and ~35 throughout the iterations.
* Tp = 100k: Fluctuates between ~20 and ~30 throughout the iterations.
### Key Observations
* Higher Tp values (1M) generally lead to greater depth and widening factor, but also higher values for First_in_channel.
* The number of branches (NB Branches) decreases initially for all Tp values, suggesting a pruning or simplification of the network structure.
* The widening factor increases significantly with higher Tp values, indicating a more complex network architecture.
* The error bars suggest considerable variance in the metrics, particularly at later iterations.
### Interpretation
These charts provide insights into the training dynamics of a neural network with varying parameter counts (Tp). The decreasing depth and NB Branches suggest that the network is being compressed or regularized during training. The increasing widening factor for Tp = 1M indicates that the network is becoming more expressive, potentially at the cost of increased computational complexity. The fluctuations in First_in_channel suggest that the network is exploring different feature representations during training.
The differences between the Tp values highlight the trade-offs between model capacity and efficiency. Higher Tp values allow for more complex models but may require more computational resources and data. The optimal Tp value likely depends on the specific task and available resources. The error bars indicate that the training process is stochastic and that the observed trends may not be consistent across different runs. Further analysis, such as averaging over multiple training runs, would be needed to confirm these observations.