\n
## Diagram: Dimensionality Expansion with Bit Arrays
### Overview
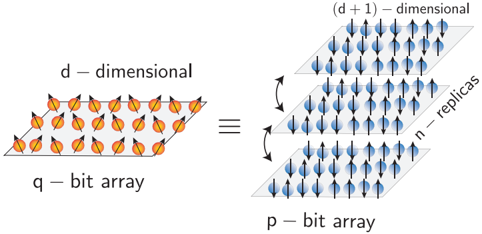
The image is a diagram illustrating the relationship between a d-dimensional n-bit array and a (d+1)-dimensional p-bit array. It visually represents an expansion of dimensionality achieved through replication. The diagram uses a visual metaphor of arrays of points with arrows to represent the dimensionality and bit representation.
### Components/Axes
The diagram consists of two main sections separated by an equals sign ("===").
* **Left Side:** A d-dimensional array represented by orange circles with arrows pointing outwards. Labeled "d - dimensional" and "n - bit array".
* **Right Side:** A (d+1)-dimensional array represented by blue arrowheads. This side is composed of 'n' replicas of the d-dimensional array stacked on top of each other. Labeled "(d + 1) - dimensional", "n - replicas", and "p - bit array".
* **Arrows:** Curved arrows connect the d-dimensional array to the (d+1)-dimensional array, indicating the replication process.
### Detailed Analysis or Content Details
The diagram doesn't contain numerical data points, but it conveys a conceptual relationship.
* **Dimensionality:** The left side represents a space with 'd' dimensions, while the right side represents a space with 'd+1' dimensions.
* **Bit Representation:** The left side is described as an "n-bit array", and the right side as a "p-bit array". The relationship between 'n' and 'p' is implied through the replication process.
* **Replication:** The right side shows 'n' copies (replicas) of the d-dimensional array stacked to create the (d+1)-dimensional array.
* **Visual Representation:** The orange circles on the left represent data points in the d-dimensional space, and the arrows indicate the direction or magnitude of some property associated with each point. The blue arrowheads on the right represent the same data points in the expanded (d+1)-dimensional space.
### Key Observations
The diagram highlights a method for increasing dimensionality by replicating an existing array. The replication process is visually emphasized by the stacking of the arrays and the curved arrows. The diagram does not provide specific values for 'd', 'n', or 'p', but it establishes a conceptual link between them.
### Interpretation
This diagram likely illustrates a concept in machine learning or data representation, specifically related to feature engineering or expanding the feature space. The replication of the d-dimensional array to create the (d+1)-dimensional array suggests a technique for creating new features from existing ones.
The 'n-bit array' and 'p-bit array' labels suggest that the dimensionality expansion is also related to the representation of data using bits. The diagram could be illustrating how a lower-dimensional bit array can be expanded into a higher-dimensional bit array through replication, potentially for encoding or processing information.
The diagram is a conceptual illustration and does not provide quantitative data. It serves to visually explain a relationship between dimensionality, bit representation, and replication. The equal sign suggests an equivalence or transformation between the two array representations. The diagram is a simplified representation of a potentially complex process, and further context would be needed to fully understand its specific application.