## Line Chart: Matchness and Speedup vs. Number of Instances
### Overview
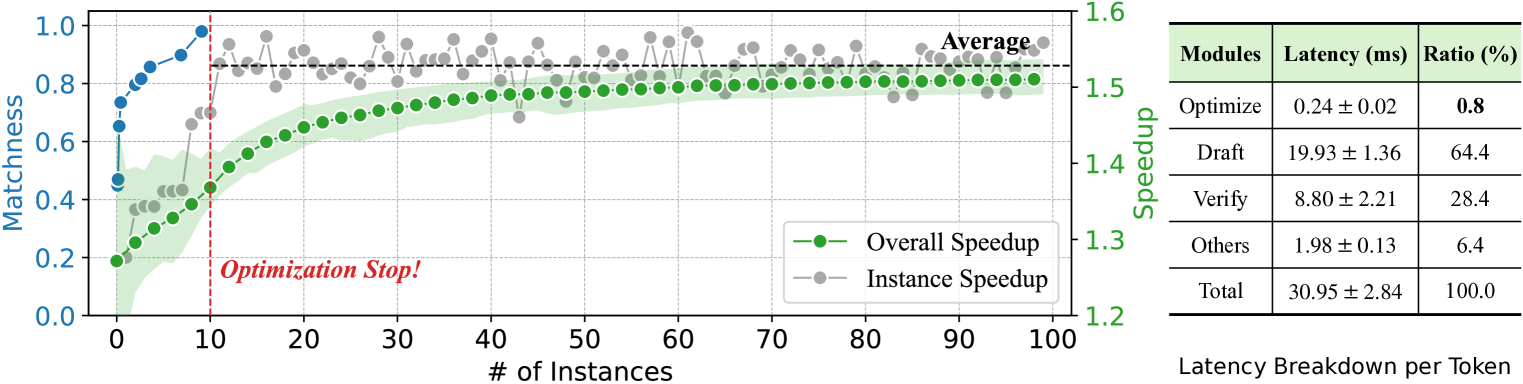
The image presents a line chart showing the relationship between the number of instances and two metrics: Matchness (left y-axis) and Speedup (right y-axis). There are two speedup metrics: Overall Speedup and Instance Speedup. A vertical dashed line indicates an "Optimization Stop!" point. A table on the right provides a latency breakdown per token for different modules.
### Components/Axes
* **X-axis:** "# of Instances", ranging from 0 to 100 in increments of 10.
* **Left Y-axis:** "Matchness", ranging from 0.0 to 1.0 in increments of 0.2.
* **Right Y-axis:** "Speedup", ranging from 1.2 to 1.6 in increments of 0.1.
* **Legend (bottom-right):**
* Green line with circles: "Overall Speedup"
* Gray line with circles: "Instance Speedup"
* **Vertical dashed red line:** Labeled "Optimization Stop!" at approximately x=11.
* **Horizontal dashed black line:** Labeled "Average" at approximately y=1.55 (speedup).
* **Table (right side):** "Latency Breakdown per Token"
* Columns: "Modules", "Latency (ms)", "Ratio (%)"
* Rows: "Optimize", "Draft", "Verify", "Others", "Total"
### Detailed Analysis
**1. Matchness (Blue Line):**
* Trend: The Matchness line slopes sharply upward from approximately 0.1 to 0.9 within the first 10 instances, then plateaus around 1.0.
* Data Points:
* Instance 0: Matchness ≈ 0.1
* Instance 5: Matchness ≈ 0.7
* Instance 10: Matchness ≈ 0.9
* Instance 15-100: Matchness ≈ 1.0
**2. Overall Speedup (Green Line):**
* Trend: The Overall Speedup line slopes upward from approximately 1.2 to 1.5 within the first 70 instances, then plateaus around 1.5. A shaded green area represents the uncertainty.
* Data Points:
* Instance 0: Speedup ≈ 1.2
* Instance 10: Speedup ≈ 1.4
* Instance 40: Speedup ≈ 1.5
* Instance 70-100: Speedup ≈ 1.52
**3. Instance Speedup (Gray Line):**
* Trend: The Instance Speedup line fluctuates between 0.85 and 0.95 after the "Optimization Stop!".
* Data Points:
* Instance 0: Speedup ≈ 0.3
* Instance 10: Speedup ≈ 0.7
* Instance 40: Speedup ≈ 0.9
* Instance 70-100: Speedup ≈ 0.9
**4. Latency Breakdown Table:**
| Modules | Latency (ms) | Ratio (%) |
| -------- | ------------- | --------- |
| Optimize | 0.24 ± 0.02 | 0.8 |
| Draft | 19.93 ± 1.36 | 64.4 |
| Verify | 8.80 ± 2.21 | 28.4 |
| Others | 1.98 ± 0.13 | 6.4 |
| Total | 30.95 ± 2.84 | 100.0 |
### Key Observations
* Matchness increases rapidly in the initial instances and then stabilizes.
* Overall Speedup shows a gradual increase and then plateaus.
* Instance Speedup fluctuates around an average value after the optimization stop.
* The "Draft" module contributes the most to the total latency, accounting for 64.4% of the total latency.
### Interpretation
The chart suggests that the optimization process significantly improves Matchness in the early stages. The Overall Speedup also benefits from the optimization, showing a steady increase. The Instance Speedup, however, fluctuates, indicating variability in individual instances. The latency breakdown highlights that the "Draft" module is the most time-consuming, suggesting it could be a target for further optimization. The "Optimization Stop!" point likely indicates a point where the optimization process was halted, possibly due to diminishing returns or other constraints.