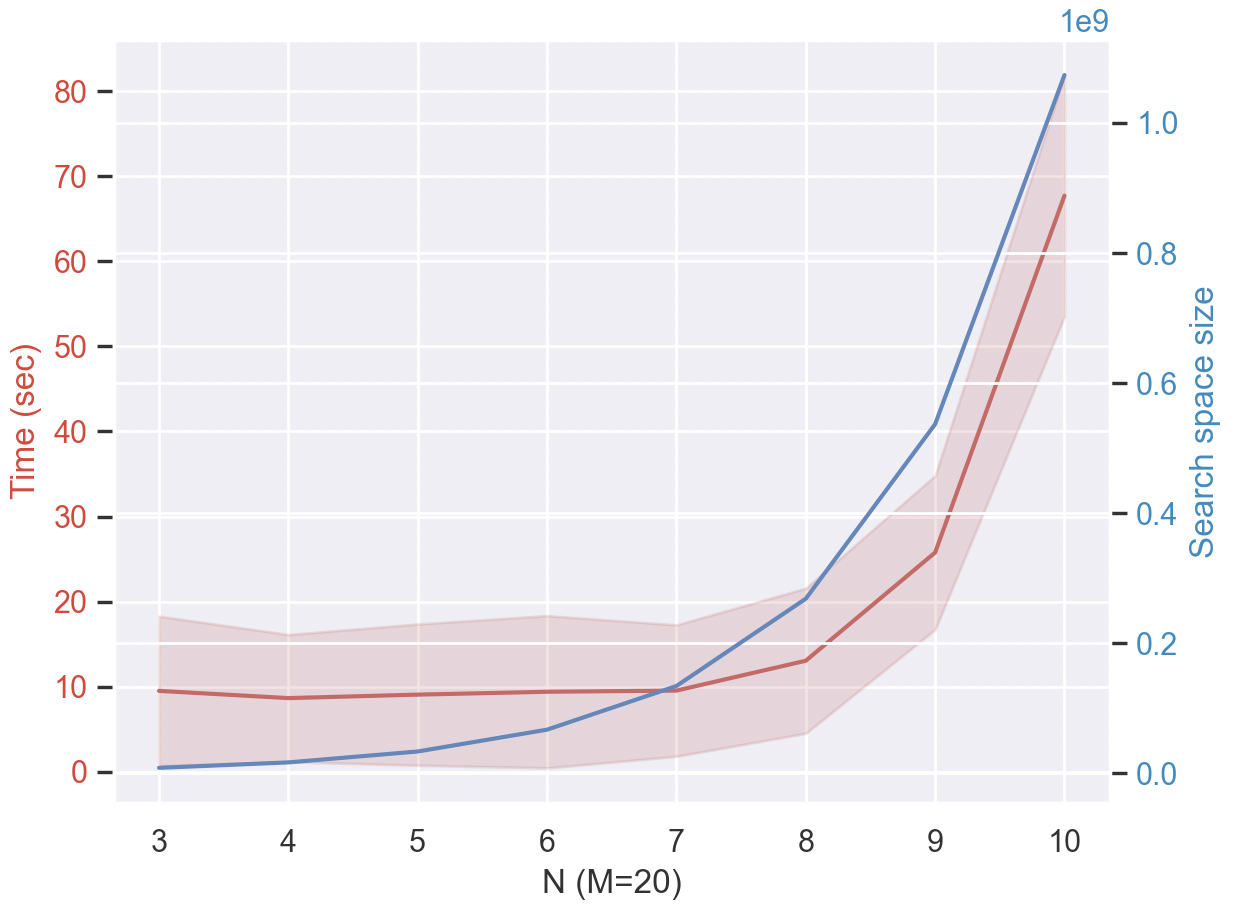
## Line Chart: Time and Search Space Size vs. N (M=20)
### Overview
The image is a line chart displaying the relationship between 'N (M=20)' on the x-axis and two different metrics on the y-axes: 'Time (sec)' on the left y-axis and 'Search space size' on the right y-axis. The chart shows how these metrics change as 'N' increases from 3 to 10. The 'Time (sec)' data is represented by a red line with a shaded area indicating variability, while the 'Search space size' is represented by a blue line.
### Components/Axes
* **X-axis:** Labeled "N (M=20)", with numerical values ranging from 3 to 10 in increments of 1.
* **Left Y-axis:** Labeled "Time (sec)", with numerical values ranging from 0 to 80 in increments of 10.
* **Right Y-axis:** Labeled "Search space size", with numerical values ranging from 0.0 to 1e9 (1.0) in increments of 0.2.
* **Data Series 1:** Red line representing "Time (sec)". A shaded area around the red line indicates the variability or uncertainty in the time measurements.
* **Data Series 2:** Blue line representing "Search space size".
### Detailed Analysis
* **Time (sec) - Red Line:**
* At N=3, Time is approximately 9 seconds.
* At N=4, Time is approximately 9 seconds.
* At N=5, Time is approximately 9 seconds.
* At N=6, Time is approximately 9 seconds.
* At N=7, Time is approximately 10 seconds.
* At N=8, Time is approximately 13 seconds.
* At N=9, Time is approximately 30 seconds.
* At N=10, Time is approximately 70 seconds.
* Trend: The time remains relatively constant until N=8, after which it increases sharply.
* **Search space size - Blue Line:**
* At N=3, Search space size is approximately 0.01e9.
* At N=4, Search space size is approximately 0.02e9.
* At N=5, Search space size is approximately 0.03e9.
* At N=6, Search space size is approximately 0.05e9.
* At N=7, Search space size is approximately 0.08e9.
* At N=8, Search space size is approximately 0.15e9.
* At N=9, Search space size is approximately 0.40e9.
* At N=10, Search space size is approximately 0.82e9.
* Trend: The search space size increases steadily with N, with a more pronounced increase after N=8.
### Key Observations
* The 'Time (sec)' remains relatively stable for N values between 3 and 7, then increases significantly for N values of 8, 9, and 10.
* The 'Search space size' shows a consistent upward trend as N increases, with a steeper increase observed for N values of 9 and 10.
* Both 'Time (sec)' and 'Search space size' exhibit a rapid increase as N approaches 10.
### Interpretation
The chart suggests that as the value of 'N' increases (with 'M' held constant at 20), both the time required for computation and the search space size grow. The initial stability in 'Time (sec)' indicates that the computational cost is relatively low for smaller values of 'N'. However, beyond a certain threshold (around N=8), the computational time increases dramatically, likely due to the exponential growth of the search space. This implies that the algorithm's efficiency decreases significantly as the problem size (represented by 'N') increases, potentially due to the need to explore a much larger solution space. The shaded area around the 'Time (sec)' line suggests that the variability in computation time also increases with 'N', indicating less predictable performance for larger problem sizes.