## Diagram: Apply Embedding to kv
### Overview
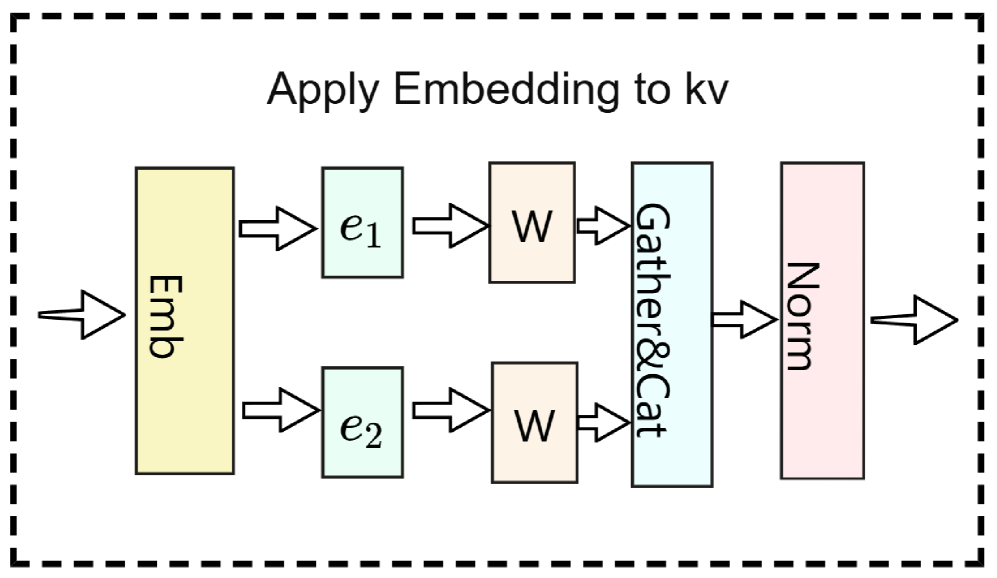
The image is a schematic block diagram illustrating a data processing pipeline, titled "Apply Embedding to kv". The diagram depicts a sequential process that begins with an embedding layer, splits into two parallel processing branches, converges into a concatenation operation, and concludes with a normalization step. The entire process is enclosed within a dashed-line rectangular border.
### Components/Axes
The diagram flows from left to right. The components are color-coded and arranged as follows:
* **Header:** "Apply Embedding to kv" (centered above the diagram).
* **Input Stage (Far Left):**
* **"Emb"**: A yellow rectangular block. An arrow enters from the left.
* **Parallel Processing Branches (Middle):**
* **Top Branch**:
* **"e1"**: A light green rectangular block.
* **"W"**: A light orange rectangular block.
* **Bottom Branch**:
* **"e2"**: A light green rectangular block.
* **"W"**: A light orange rectangular block.
* **Convergence Stage (Middle-Right):**
* **"Gather&Cat"**: A light blue vertical rectangular block. Both parallel branches feed into this block.
* **Output Stage (Far Right):**
* **"Norm"**: A light pink vertical rectangular block. An arrow exits to the right.
### Detailed Analysis
The flow of data through the diagram is as follows:
1. **Initial Embedding**: Data enters the system via an arrow pointing into the **"Emb"** (yellow) block.
2. **Branching**: The output of the "Emb" block splits into two identical parallel paths.
* **Top Path**: The signal flows from "Emb" to **"e1"** (light green), then to **"W"** (light orange), and finally into the **"Gather&Cat"** (light blue) block.
* **Bottom Path**: The signal flows from "Emb" to **"e2"** (light green), then to **"W"** (light orange), and finally into the **"Gather&Cat"** (light blue) block.
3. **Aggregation**: The **"Gather&Cat"** block acts as a junction, receiving inputs from both the top and bottom "W" blocks.
4. **Normalization**: The output of the "Gather&Cat" block flows into the **"Norm"** (light pink) block.
5. **Final Output**: The processed data exits the "Norm" block via an arrow pointing to the right.
### Key Observations
* **Symmetry**: The diagram exhibits strong vertical symmetry. The top and bottom branches are identical in structure ("e" -> "W"), suggesting that the system processes two distinct components (e1 and e2) in parallel using similar transformation weights (W).
* **Color Coding**: The color scheme is consistent across functional groups:
* Yellow: Initial embedding.
* Light Green: Intermediate feature/embedding vectors.
* Light Orange: Transformation/Weight matrices.
* Light Blue: Aggregation/Concatenation operation.
* Light Pink: Normalization layer.
* **Flow**: The diagram clearly delineates a "split-transform-merge" architecture.
### Interpretation
This diagram represents a specific architectural pattern often found in neural networks, particularly those involving attention mechanisms or multi-modal data processing.
* **"kv" Context**: The title "Apply Embedding to kv" strongly suggests this is a mechanism for generating Key (k) and Value (v) vectors used in Transformer-based architectures.
* **Functional Logic**:
* The "Emb" block likely creates a shared representation of the input.
* The split into "e1" and "e2" suggests the generation of two distinct feature sets (e.g., one for keys, one for values, or two different attention heads).
* The "W" blocks represent learned linear projections (weights) applied to these features.
* "Gather&Cat" implies that these transformed features are collected and concatenated into a single tensor.
* "Norm" (likely Layer Normalization) is applied at the end to stabilize the output before it is passed to subsequent layers in the network.
* **Significance**: This architecture allows the model to derive multiple, distinct representations from a single input source simultaneously, which is a fundamental requirement for complex sequence modeling.