## Heatmap Matrix: AI Model Progress Ratio Comparison
### Overview
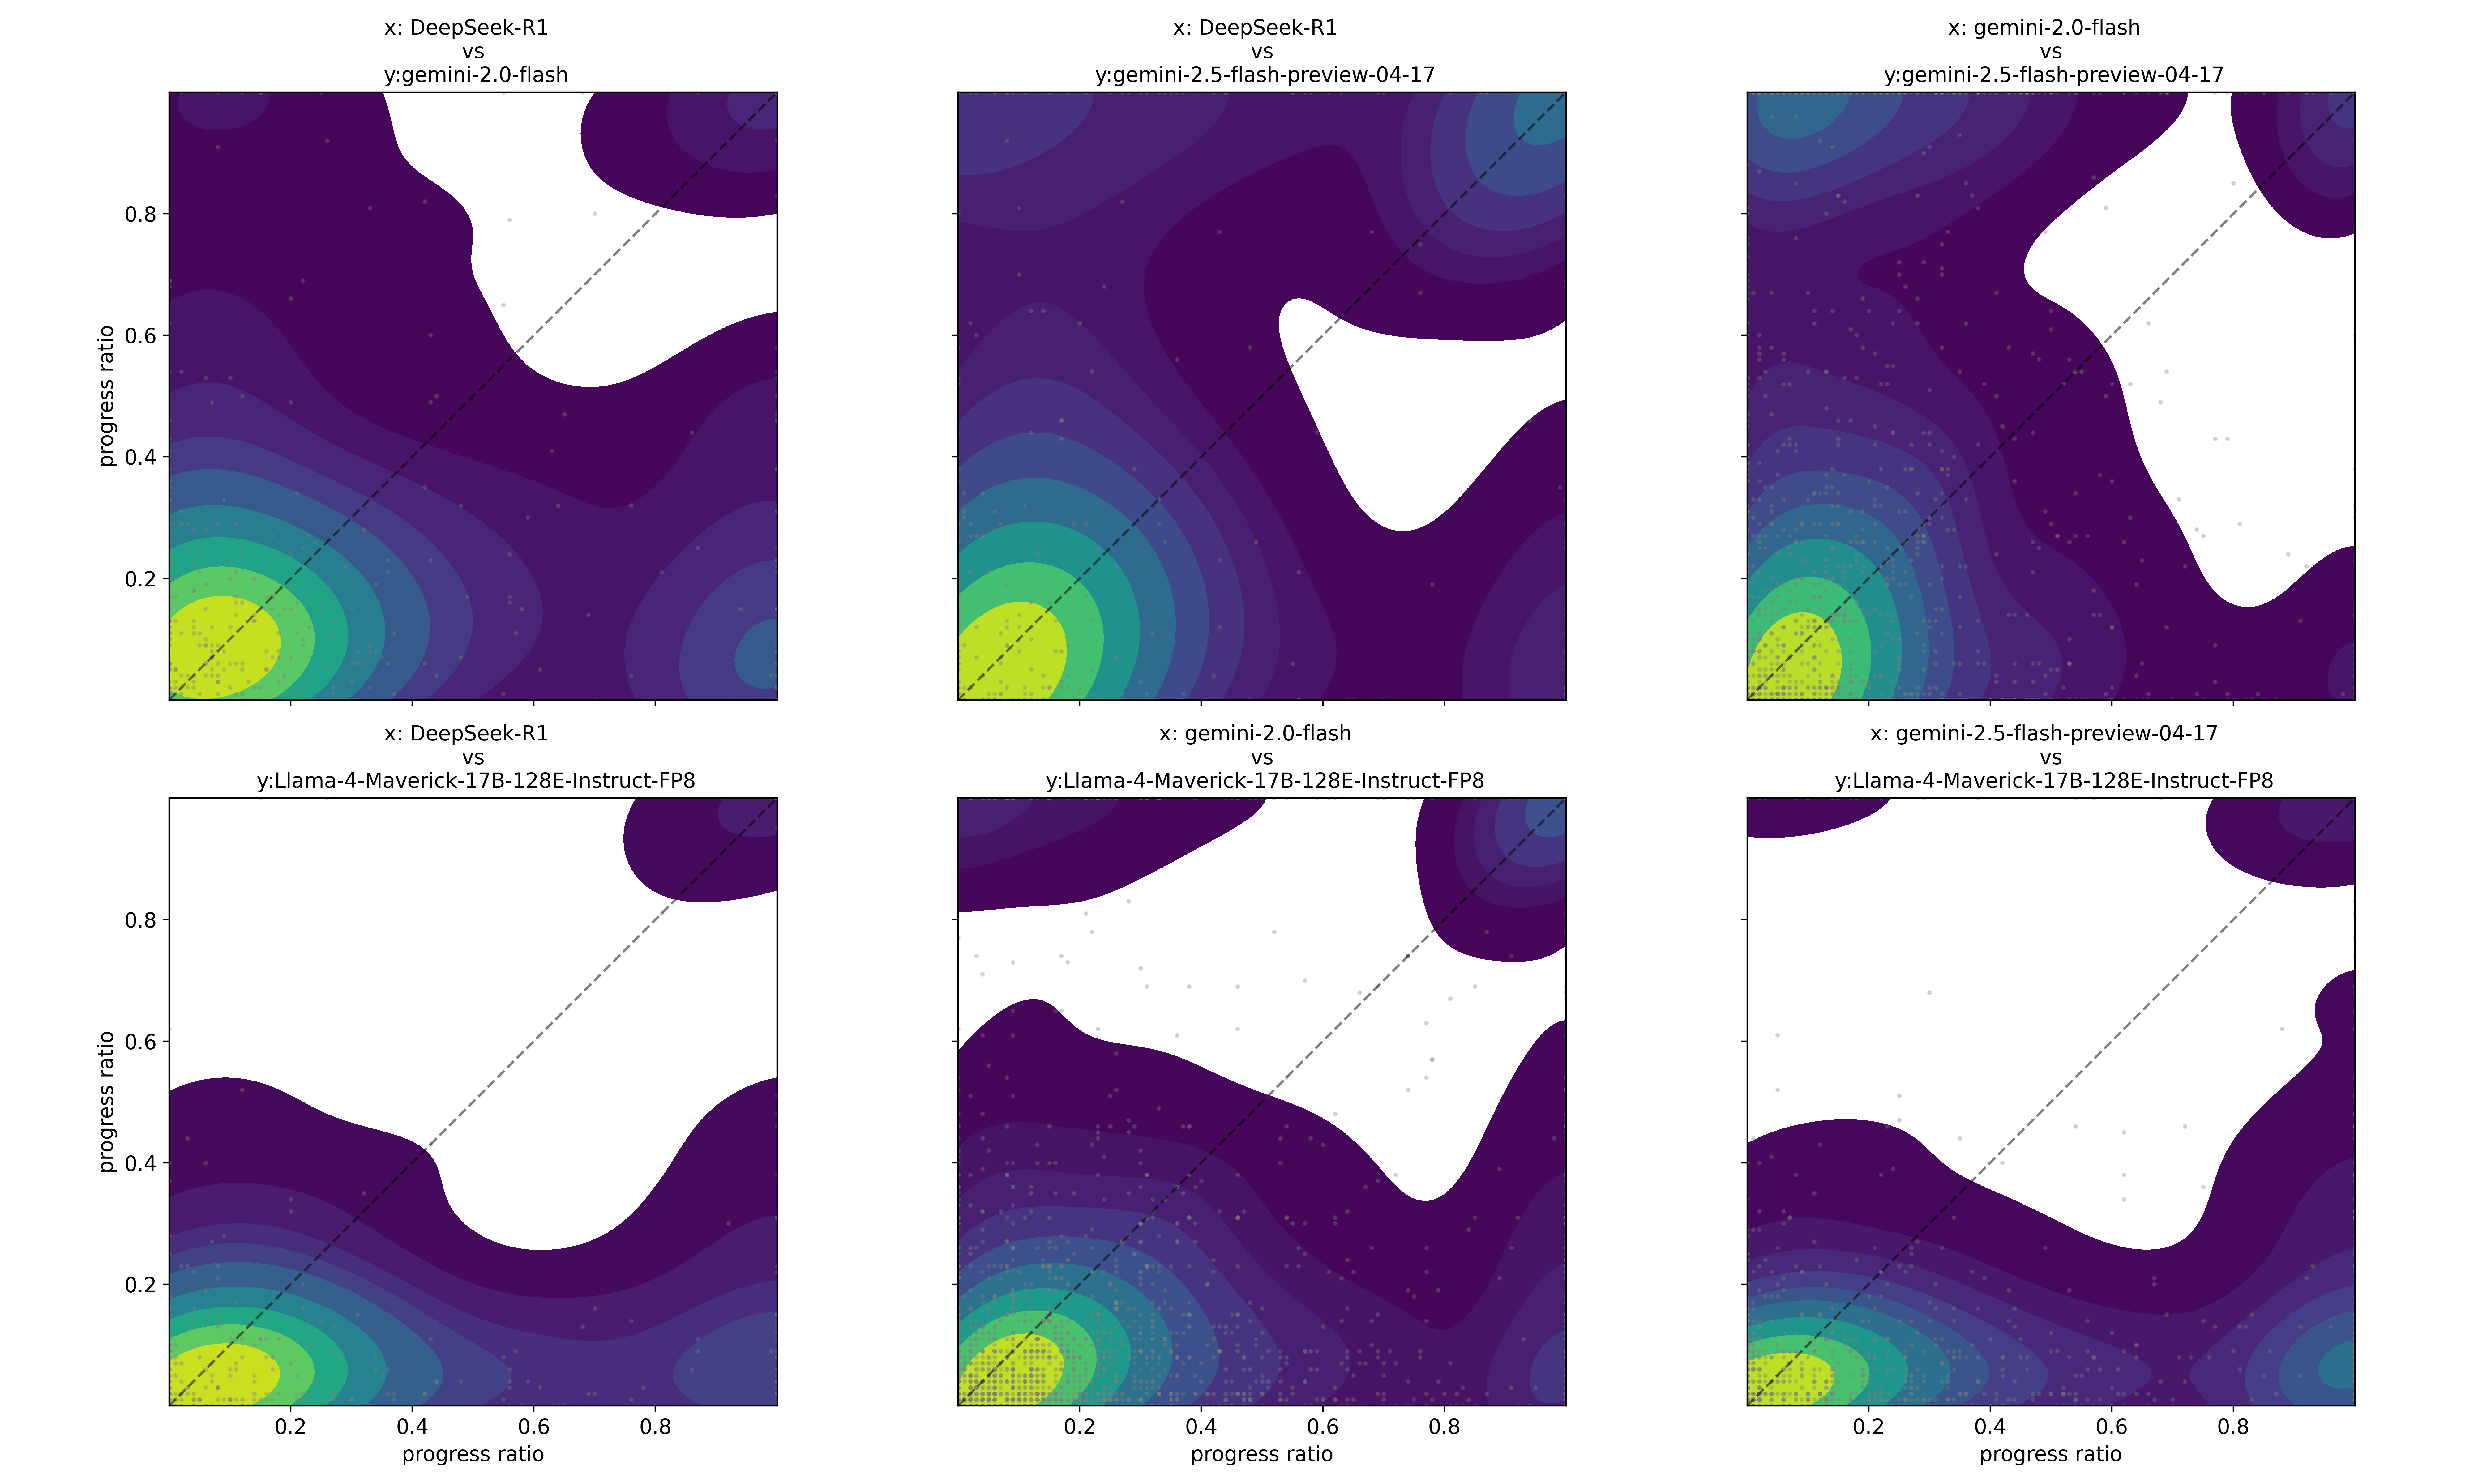
This image displays a 2x3 grid of density heatmaps comparing the "progress ratio" of various AI models against one another. Each plot visualizes the correlation of performance between two specific models. The density of data points is represented by a color gradient, ranging from dark purple (low density) to yellow/green (high density). A dashed diagonal line (y=x) is present in each plot to indicate parity; points above the line indicate the model on the Y-axis performed better, while points below the line indicate the model on the X-axis performed better.
### Components/Axes
* **Grid Layout:** 2 rows by 3 columns.
* **Axes:** Both X and Y axes represent "progress ratio," scaled from 0.0 to 0.8 (with tick marks at 0.2, 0.4, 0.6, 0.8).
* **Data Representation:**
* **Scatter:** Light grey dots represent individual data points.
* **Density:** Overlaid color gradient (Purple to Yellow/Green) indicates the concentration of data points.
* **Reference:** A dashed diagonal line represents the line of equality (where both models have the same progress ratio).
### Detailed Analysis
#### Row 1
* **Top-Left (x: DeepSeek-R1 vs y: gemini-2.0-flash):**
* **Trend:** High density at the origin (0,0). A significant portion of the density cloud lies above the diagonal line, indicating that *gemini-2.0-flash* generally achieves a higher progress ratio than *DeepSeek-R1*.
* **Top-Center (x: DeepSeek-R1 vs y: gemini-2.5-flash-preview-04-17):**
* **Trend:** High density at the origin. The density cloud is heavily skewed above the diagonal, indicating *gemini-2.5-flash-preview-04-17* consistently outperforms *DeepSeek-R1*.
* **Top-Right (x: gemini-2.0-flash vs y: gemini-2.5-flash-preview-04-17):**
* **Trend:** High density at the origin. The distribution is tightly clustered along the diagonal, but with a noticeable bias above the diagonal, suggesting *gemini-2.5-flash-preview-04-17* is slightly superior to *gemini-2.0-flash*.
#### Row 2
* **Bottom-Left (x: DeepSeek-R1 vs y: Llama-4-Maverick-17B-128E-Instruct-FP8):**
* **Trend:** High density at the origin. The density cloud is heavily skewed *below* the diagonal, indicating *DeepSeek-R1* significantly outperforms *Llama-4-Maverick-17B-128E-Instruct-FP8*.
* **Bottom-Center (x: gemini-2.0-flash vs y: Llama-4-Maverick-17B-128E-Instruct-FP8):**
* **Trend:** High density at the origin. The density cloud is heavily skewed *below* the diagonal, indicating *gemini-2.0-flash* significantly outperforms *Llama-4-Maverick-17B-128E-Instruct-FP8*.
* **Bottom-Right (x: gemini-2.5-flash-preview-04-17 vs y: Llama-4-Maverick-17B-128E-Instruct-FP8):**
* **Trend:** High density at the origin. The density cloud is heavily skewed *below* the diagonal, indicating *gemini-2.5-flash-preview-04-17* significantly outperforms *Llama-4-Maverick-17B-128E-Instruct-FP8*.
### Key Observations
* **Universal Origin Cluster:** In all six plots, there is a very high density of points at the (0,0) coordinate. This suggests that for a large number of tasks, all models either fail immediately or make very little progress.
* **Performance Hierarchy:**
1. *gemini-2.5-flash-preview-04-17* appears to be the strongest model in this set.
2. *gemini-2.0-flash* and *DeepSeek-R1* are competitive with each other, though *gemini-2.0-flash* shows a slight edge.
3. *Llama-4-Maverick-17B-128E-Instruct-FP8* is the weakest performer, consistently falling below the diagonal when compared to the other three models.
### Interpretation
This matrix provides a comparative performance analysis of four AI models based on a "progress ratio" metric, which likely quantifies how far a model gets through a multi-step reasoning or generation task.
* **The "Llama" Gap:** The bottom row clearly demonstrates that *Llama-4-Maverick* struggles to keep pace with the Gemini and DeepSeek models. The density is consistently pushed below the diagonal, meaning the X-axis models (the Gemini/DeepSeek variants) are reaching higher progress ratios than the Llama model.
* **Gemini Evolution:** The top-right plot (Gemini 2.0 vs 2.5) shows that while the models are very similar, the 2.5-flash-preview version has a distinct advantage, as the density is shifted above the parity line.
* **Task Difficulty:** The heavy clustering at (0,0) across all charts suggests that the dataset contains a significant number of "hard" or "impossible" tasks where none of the models are able to make meaningful progress. The models are differentiated primarily by their ability to handle the tasks that *do* allow for progress (the spread away from the origin).