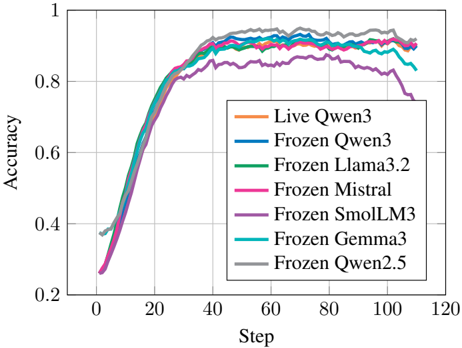
## Line Chart: Model Accuracy vs. Step
### Overview
The image is a line chart comparing the accuracy of different language models (Live Qwen3, Frozen Qwen3, Frozen Llama3.2, Frozen Mistral, Frozen SmolLM3, Frozen Gemma3, and Frozen Qwen2.5) over a number of steps. The y-axis represents accuracy, ranging from 0.2 to 1.0, and the x-axis represents the step number, ranging from 0 to 120.
### Components/Axes
* **X-axis:** "Step" - Ranges from 0 to 120 in increments of 20.
* **Y-axis:** "Accuracy" - Ranges from 0.2 to 1.0 in increments of 0.2.
* **Legend:** Located in the bottom-right of the chart, it identifies each line by model name and color:
* Orange: Live Qwen3
* Blue: Frozen Qwen3
* Green: Frozen Llama3.2
* Pink: Frozen Mistral
* Purple: Frozen SmolLM3
* Teal: Frozen Gemma3
* Gray: Frozen Qwen2.5
### Detailed Analysis
* **Live Qwen3 (Orange):** The accuracy of Live Qwen3 increases rapidly from approximately 0.3 at step 0 to around 0.85 by step 40. It then plateaus and fluctuates slightly between 0.85 and 0.90 until step 120.
* **Frozen Qwen3 (Blue):** Similar to Live Qwen3, Frozen Qwen3's accuracy increases sharply from approximately 0.3 at step 0 to around 0.85 by step 40. It then plateaus and fluctuates slightly between 0.85 and 0.95 until step 120.
* **Frozen Llama3.2 (Green):** The accuracy of Frozen Llama3.2 also increases rapidly from approximately 0.35 at step 0 to around 0.85 by step 40. It then plateaus and fluctuates slightly between 0.85 and 0.95 until step 120.
* **Frozen Mistral (Pink):** The accuracy of Frozen Mistral increases rapidly from approximately 0.25 at step 0 to around 0.80 by step 40. It then plateaus and fluctuates slightly between 0.80 and 0.90 until step 120.
* **Frozen SmolLM3 (Purple):** The accuracy of Frozen SmolLM3 increases rapidly from approximately 0.25 at step 0 to around 0.80 by step 40. It then plateaus and fluctuates slightly between 0.80 and 0.90 until step 120.
* **Frozen Gemma3 (Teal):** The accuracy of Frozen Gemma3 increases rapidly from approximately 0.35 at step 0 to around 0.85 by step 40. It then plateaus and fluctuates slightly between 0.85 and 0.95 until step 120.
* **Frozen Qwen2.5 (Gray):** The accuracy of Frozen Qwen2.5 increases rapidly from approximately 0.38 at step 0 to around 0.88 by step 40. It then plateaus and fluctuates slightly between 0.88 and 0.98 until step 120.
### Key Observations
* All models show a rapid increase in accuracy during the initial steps (0-40).
* After step 40, the accuracy of all models plateaus, with minor fluctuations.
* Frozen Qwen2.5 (Gray) appears to have the highest overall accuracy after step 40.
* Frozen Mistral (Pink) and Frozen SmolLM3 (Purple) appear to have the lowest overall accuracy after step 40.
* The "Live Qwen3" model performs comparably to the "Frozen" models.
### Interpretation
The chart illustrates the learning curves of different language models. The rapid increase in accuracy during the initial steps indicates the models are quickly learning from the training data. The plateau after step 40 suggests that the models have reached a point of diminishing returns, where further training steps yield only marginal improvements in accuracy. The slight fluctuations in accuracy after the plateau may be due to the inherent variability in the training data or the learning process. The fact that the "Live Qwen3" model performs similarly to the "Frozen" models suggests that freezing the model parameters does not significantly impact its performance in this context. The differences in accuracy between the models may be attributed to variations in their architecture, training data, or hyperparameter settings.