## Line Graph: Loss Comparison Between MRL and SMRL Over Epochs
### Overview
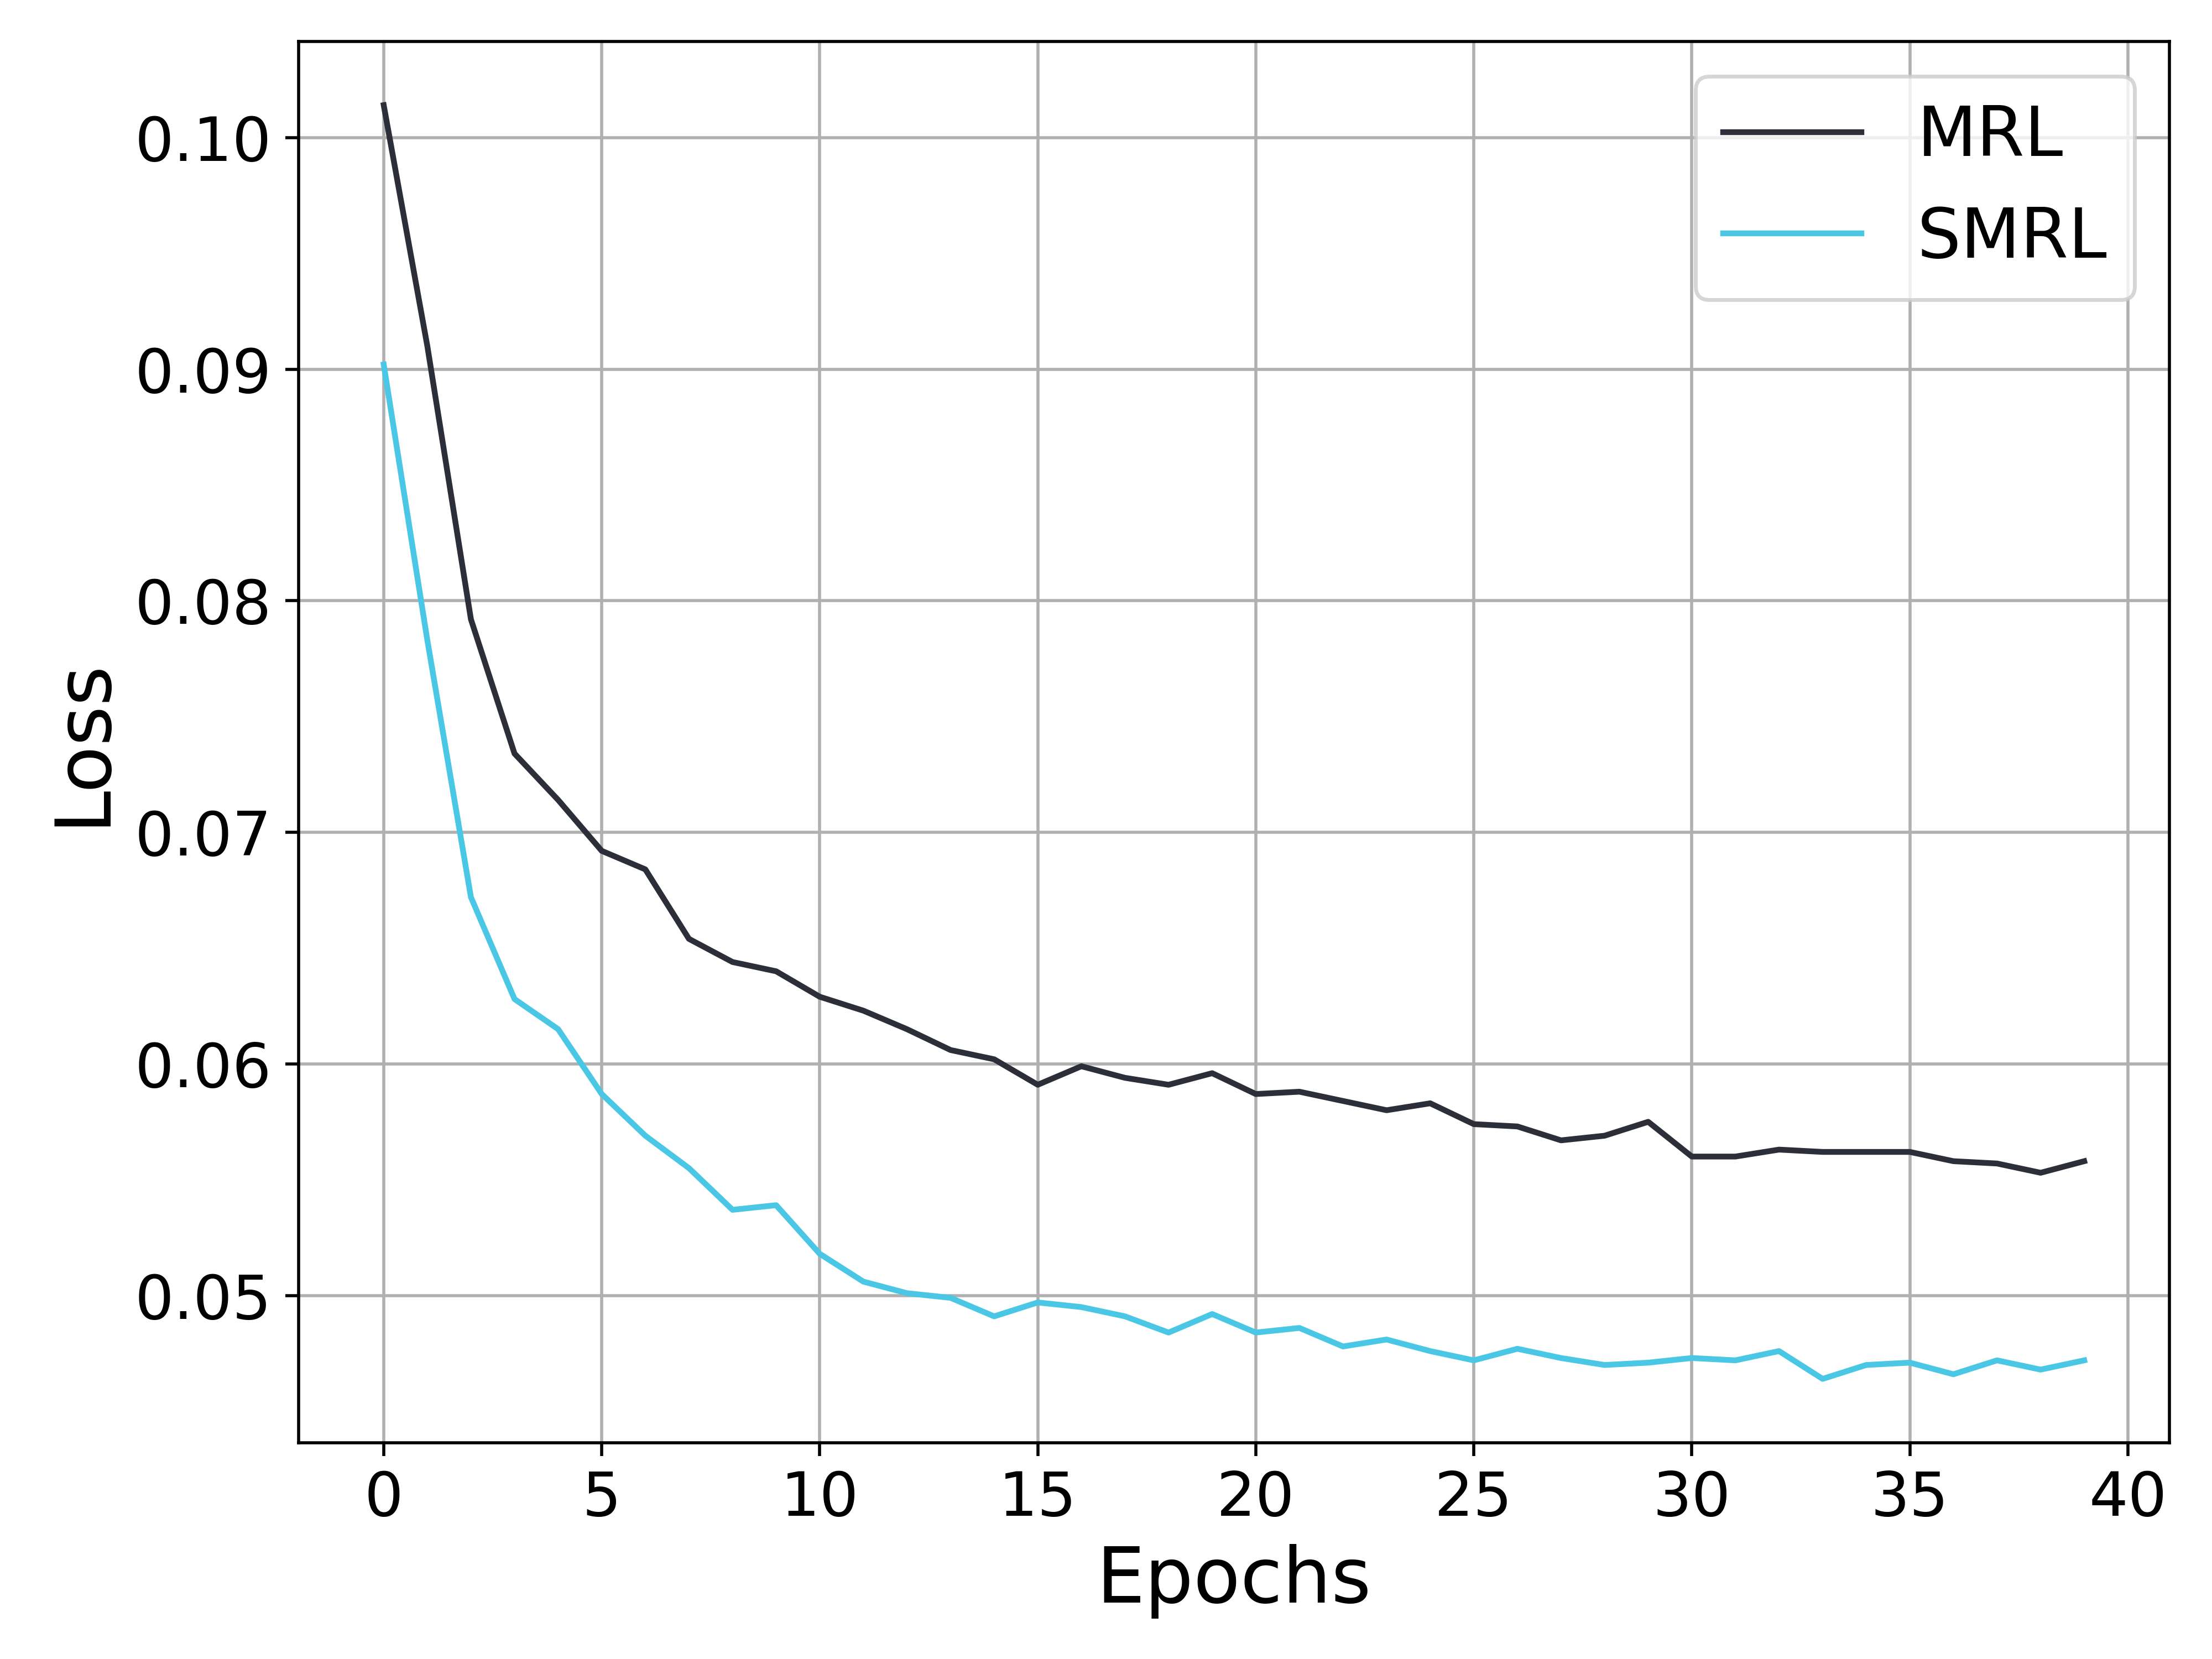
The image depicts a line graph comparing the loss values of two algorithms, MRL (black line) and SMRL (blue line), across 40 training epochs. Both lines show a general downward trend, with MRL starting at a higher loss value and converging toward SMRL's trajectory over time.
### Components/Axes
- **X-axis (Epochs)**: Ranges from 0 to 40 in increments of 5.
- **Y-axis (Loss)**: Ranges from 0.05 to 0.10 in increments of 0.01.
- **Legend**: Located in the top-right corner, with:
- **Black line**: Labeled "MRL"
- **Blue line**: Labeled "SMRL"
### Detailed Analysis
1. **MRL (Black Line)**:
- **Initial Value**: At epoch 0, loss ≈ 0.102.
- **Trend**: Steep decline until epoch 5 (loss ≈ 0.078), followed by a gradual decrease.
- **Final Value**: At epoch 40, loss ≈ 0.055.
- **Notable**: Sharpest drop occurs between epochs 0–5.
2. **SMRL (Blue Line)**:
- **Initial Value**: At epoch 0, loss ≈ 0.090.
- **Trend**: Gradual decline until epoch 10 (loss ≈ 0.052), then stabilizes with minor fluctuations.
- **Final Value**: At epoch 40, loss ≈ 0.045.
- **Notable**: Smoother, less volatile trajectory compared to MRL.
3. **Convergence**:
- The two lines intersect near epoch 10 (MRL ≈ 0.062, SMRL ≈ 0.052).
- Post-convergence, MRL maintains a slightly higher loss than SMRL but at a reduced rate.
### Key Observations
- **Early Performance**: MRL exhibits a faster initial reduction in loss, suggesting stronger early optimization.
- **Long-Term Stability**: SMRL demonstrates more consistent performance after epoch 10, with smaller fluctuations.
- **Convergence Point**: Both algorithms achieve similar loss values (~0.055–0.058) by epoch 20, indicating comparable effectiveness in later stages.
### Interpretation
The graph suggests that MRL may be more effective in rapidly reducing loss during the initial training phases, while SMRL offers greater stability and sustained improvement over time. The convergence near epoch 10 implies that both methods could achieve comparable results with sufficient training, though SMRL’s smoother trajectory might reduce the risk of overfitting or erratic behavior. The slight dip in SMRL’s loss around epoch 20 (≈0.048) could indicate a minor optimization milestone or noise in the data. Overall, the trends highlight trade-offs between early efficiency (MRL) and long-term reliability (SMRL).