# Technical Data Extraction: Streamline and Heatmap Analysis
This document provides a detailed technical extraction of the provided image, which consists of two side-by-side scientific plots (labeled 'f' and 'h') representing physical simulations, likely related to electron flow or current density in a nanostructure.
## 1. Global Metadata
* **Language:** English
* **Primary Components:** Two subplots with heatmaps, streamline overlays, and color bars.
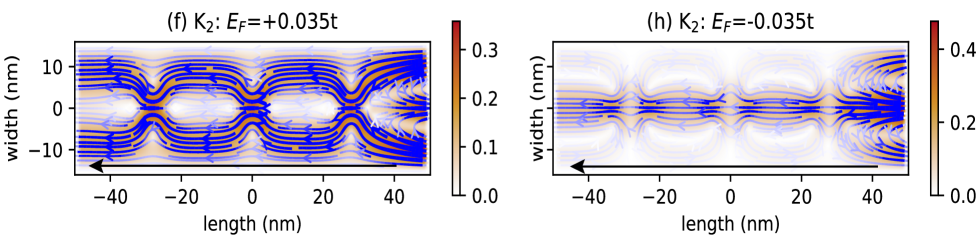
* **X-Axis (Common):** `length (nm)` ranging from approximately -50 to 50.
* **Y-Axis (Common):** `width (nm)` ranging from -15 to 15.
* **Directional Indicator:** A black arrow at the bottom of both plots points from right to left (from +40 to -45 on the x-axis).
---
## 2. Subplot (f) Analysis
### Header Information
* **Label:** (f)
* **Title:** $K_2: E_F = +0.035t$
### Axis and Scale
* **X-axis Markers:** -40, -20, 0, 20, 40
* **Y-axis Markers:** -10, 0, 10
* **Color Bar Range:** 0.0 to 0.3 (linear scale).
* **Color Bar Gradient:** Light beige/white (0.0) to dark orange/brown (0.3).
### Data Visualization (Heatmap & Streamlines)
* **Heatmap Trend:** The highest intensity (dark orange, ~0.3) is concentrated in horizontal bands along the top and bottom edges (approx. $y = \pm 10$ nm) and in "bottleneck" regions between circular voids.
* **Streamline Behavior:**
* Blue lines with arrows indicate flow direction.
* The flow enters from the right and moves toward the left.
* The streamlines form four distinct "cells" or vortices centered along the $y=0$ axis at roughly $x = -30, -10, 10, 30$.
* The flow is most compressed and intense (darker blue) at the narrow passages between these cells.
* **Spatial Features:** There are four low-intensity (white) circular regions centered at $y=0$, suggesting areas of zero or near-zero magnitude.
---
## 3. Subplot (h) Analysis
### Header Information
* **Label:** (h)
* **Title:** $K_2: E_F = -0.035t$
### Axis and Scale
* **X-axis Markers:** -40, -20, 0, 20, 40
* **Y-axis Markers:** -10, 0, 10
* **Color Bar Range:** 0.0 to 0.4 (linear scale). Note: This scale is higher than subplot (f).
* **Color Bar Gradient:** Light beige/white (0.0) to dark orange/brown (0.4).
### Data Visualization (Heatmap & Streamlines)
* **Heatmap Trend:** Compared to (f), the intensity is much more concentrated along the central horizontal axis ($y=0$). The edges of the channel (top and bottom) show very low intensity (white).
* **Streamline Behavior:**
* Blue lines with arrows indicate flow from right to left.
* The flow is highly collimated along the center of the channel.
* While there are subtle "pinching" effects at the same x-coordinates as subplot (f) ($x \approx \pm 10, \pm 30$), the streamlines do not form the wide, expansive loops seen in the previous plot.
* The flow appears "squeezed" into a narrow central filament.
* **Spatial Features:** The high-intensity regions (dark orange) are located at the "nodes" or pinch points along the $y=0$ line.
---
## 4. Comparative Summary
| Feature | Subplot (f) | Subplot (h) |
| :--- | :--- | :--- |
| **Fermi Energy ($E_F$)** | $+0.035t$ (Positive) | $-0.035t$ (Negative) |
| **Max Intensity Value** | ~0.3 | ~0.4 |
| **Flow Distribution** | Broad, filling the width of the channel. | Narrow, concentrated along the center. |
| **Vortex/Cell Formation** | Strong, expansive cells around $y=0$. | Weak, highly compressed flow along $y=0$. |
| **Edge Intensity** | High at $y = \pm 10$ nm. | Low at $y = \pm 10$ nm. |
**Conclusion:** The change in the sign of the Fermi energy ($E_F$) from positive to negative causes a dramatic shift in the spatial distribution of the flow, moving it from the edges and wide cells (f) to a highly concentrated central stream (h).