\n
## Scatter Plot: Confidence vs. Target Length for "professional_accounting"
### Overview
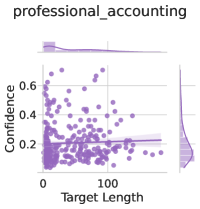
This image presents a scatter plot visualizing the relationship between "Target Length" and "Confidence" for the category "professional_accounting". A regression line with a confidence interval is overlaid on the scatter points. The plot appears to show a weak negative correlation between target length and confidence.
### Components/Axes
* **Title:** "professional\_accounting" (located at the top-center of the image)
* **X-axis:** "Target Length" (ranging from approximately 0 to 150, with gridlines at 0, 50, 100, and 150)
* **Y-axis:** "Confidence" (ranging from approximately 0.1 to 0.7, with gridlines at 0.2, 0.4, and 0.6)
* **Data Points:** Numerous purple circles representing individual data points.
* **Regression Line:** A purple line representing the trend of the data.
* **Confidence Interval:** A shaded purple area around the regression line, indicating the uncertainty in the estimated trend.
* **Histograms:** Two histograms are present on the left and right sides of the plot, showing the distribution of Target Length and Confidence respectively.
### Detailed Analysis
The scatter plot shows a distribution of points. The trend line is nearly horizontal, indicating a very weak correlation.
* **Data Point Distribution:** The majority of data points cluster between Target Length values of 0 and 100, and Confidence values between 0.15 and 0.5. There are fewer points with Target Lengths greater than 100.
* **Regression Line Trend:** The regression line slopes slightly downward, suggesting a very weak negative correlation. As Target Length increases, Confidence tends to decrease, but the effect is minimal.
* **Confidence Interval:** The confidence interval is relatively narrow, indicating some certainty in the estimated trend, despite its weakness.
* **Left Histogram (Target Length):** The histogram shows a concentration of data points at lower Target Length values, with a rapid decline as Target Length increases.
* **Right Histogram (Confidence):** The histogram shows a concentration of data points at lower Confidence values, with a gradual decline as Confidence increases.
Approximate Data Points (sampled for illustration):
* Target Length = 0, Confidence ≈ 0.6
* Target Length = 20, Confidence ≈ 0.5
* Target Length = 50, Confidence ≈ 0.35
* Target Length = 80, Confidence ≈ 0.25
* Target Length = 100, Confidence ≈ 0.2
* Target Length = 120, Confidence ≈ 0.18
### Key Observations
* The relationship between Target Length and Confidence is very weak.
* The data points are widely scattered, indicating a high degree of variability.
* The histograms suggest that lower Target Lengths and lower Confidence values are more common.
* There are no obvious outliers.
### Interpretation
The data suggests that, for the category "professional\_accounting", the length of the target text has little to no significant impact on the confidence score. The weak negative trend could be due to chance or other confounding factors. The histograms indicate that the model generally exhibits lower confidence for shorter target lengths, but this is not a strong relationship. The wide scatter of data points suggests that other variables not represented in this plot likely play a more significant role in determining confidence. The histograms provide a distribution of the data, showing that the model is more likely to produce lower confidence scores. This could be due to the inherent difficulty of the task or limitations in the model's ability to accurately assess confidence.