## Scatter Plot: Number of WRITE pulses vs. Probability scaling factor
### Overview
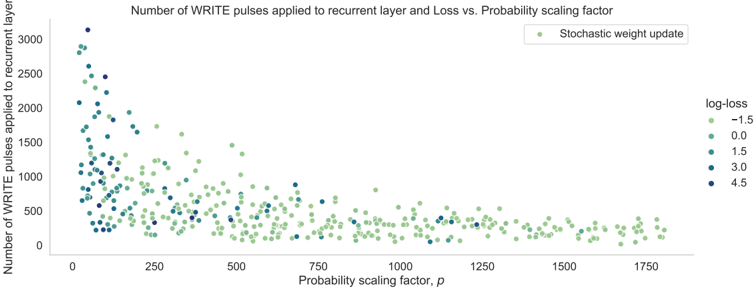
This image presents a scatter plot illustrating the relationship between the number of WRITE pulses applied to a recurrent layer and the probability scaling factor (p). The plot also visualizes the log-loss associated with different combinations of these two parameters. The data points are color-coded based on their log-loss values.
### Components/Axes
* **Title:** "Number of WRITE pulses applied to recurrent layer and Loss vs. Probability scaling factor" (Top-center)
* **X-axis:** "Probability scaling factor, p" (Bottom-center), ranging from approximately 0 to 1750.
* **Y-axis:** "Number of WRITE pulses applied to recurrent layer" (Left-center), ranging from approximately 0 to 3000.
* **Legend:** Located in the top-right corner, labeled "log-loss" with the following color-coded values:
* -1.5 (Dark Blue)
* 0.0 (Medium Blue)
* 3.0 (Light Green)
* 4.5 (Dark Green)
* **Annotation:** "Stochastic weight update" (Top-right, near the legend)
### Detailed Analysis
The scatter plot shows a general trend of decreasing WRITE pulses as the probability scaling factor increases. The data points are clustered based on their log-loss values.
* **Log-loss -1.5 (Dark Blue):** These points are concentrated at low probability scaling factors (p < 100) and high numbers of WRITE pulses (1000-3000). The trend is a steep decline in WRITE pulses as p increases. Approximate data points: (0, 2800), (10, 2200), (50, 1200), (100, 800).
* **Log-loss 0.0 (Medium Blue):** These points are more dispersed, spanning a wider range of probability scaling factors (p < 500) and WRITE pulses (500-2500). The trend is a gradual decrease in WRITE pulses as p increases. Approximate data points: (0, 1800), (50, 1500), (200, 1000), (400, 600).
* **Log-loss 3.0 (Light Green):** These points are primarily located in the middle range of probability scaling factors (p between 200 and 1000) and lower WRITE pulses (0-1500). The trend is relatively flat, with some fluctuation. Approximate data points: (200, 800), (500, 500), (800, 300).
* **Log-loss 4.5 (Dark Green):** These points are scattered across the entire range of probability scaling factors (p between 0 and 1750) and have the lowest WRITE pulse counts (0-500). The trend is a slight decrease in WRITE pulses as p increases. Approximate data points: (0, 200), (500, 100), (1000, 50), (1500, 100).
### Key Observations
* Lower log-loss values (better performance) are associated with lower probability scaling factors and higher numbers of WRITE pulses.
* As the probability scaling factor increases, the number of WRITE pulses generally decreases.
* The distribution of points with log-loss 3.0 and 4.5 is more spread out, indicating a wider range of possible outcomes for these loss values.
* There is a clear separation between the data points based on log-loss, suggesting that log-loss is a strong predictor of the relationship between WRITE pulses and the probability scaling factor.
### Interpretation
The data suggests that the number of WRITE pulses applied to the recurrent layer and the probability scaling factor are key parameters influencing the performance of the model, as measured by log-loss. A lower probability scaling factor and a higher number of WRITE pulses appear to lead to better performance (lower log-loss). The "Stochastic weight update" annotation suggests that this relationship may be influenced by the stochastic nature of the weight updates during training. The plot demonstrates a trade-off between the probability scaling factor and the number of WRITE pulses – increasing one generally decreases the other. The clustering of points based on log-loss indicates that there are distinct regions of parameter space that result in different levels of performance. The spread of points with higher log-loss values suggests that the model is more sensitive to changes in these parameters when performance is suboptimal. This data could be used to optimize the training process by selecting appropriate values for the probability scaling factor and the number of WRITE pulses.